Predicting individual personality styles using macrostructural information: A multivariate pattern study
Main Article Content
Advances in neuroimaging techniques have uncovered the relationships between neuroanatomy and personality traits like neuroticism and extraversion. Nevertheless, few studies have examined the reliable biological markers that identify individuals with different personality styles. Therefore, we evaluated the diagnostic capability of structural magnetic resonance imaging with a sample of 192 healthy adults by using a machine learning algorithm to divide them into four groups according to brain structural characteristics. Our results showed that personality styles, but not personality traits, could be discriminated with the extraversion candidate brain system (e.g., the frontal cortex, hippocampus, amygdala) and the neuroticism candidate brain system (e.g., the insula, the right anterior cingulate cortex). These findings indicate that personality styles that consider person-centered traits may more effectively predict individuals’ mental health, providing a potential brain biomarker for early individual psychological risk assessments.
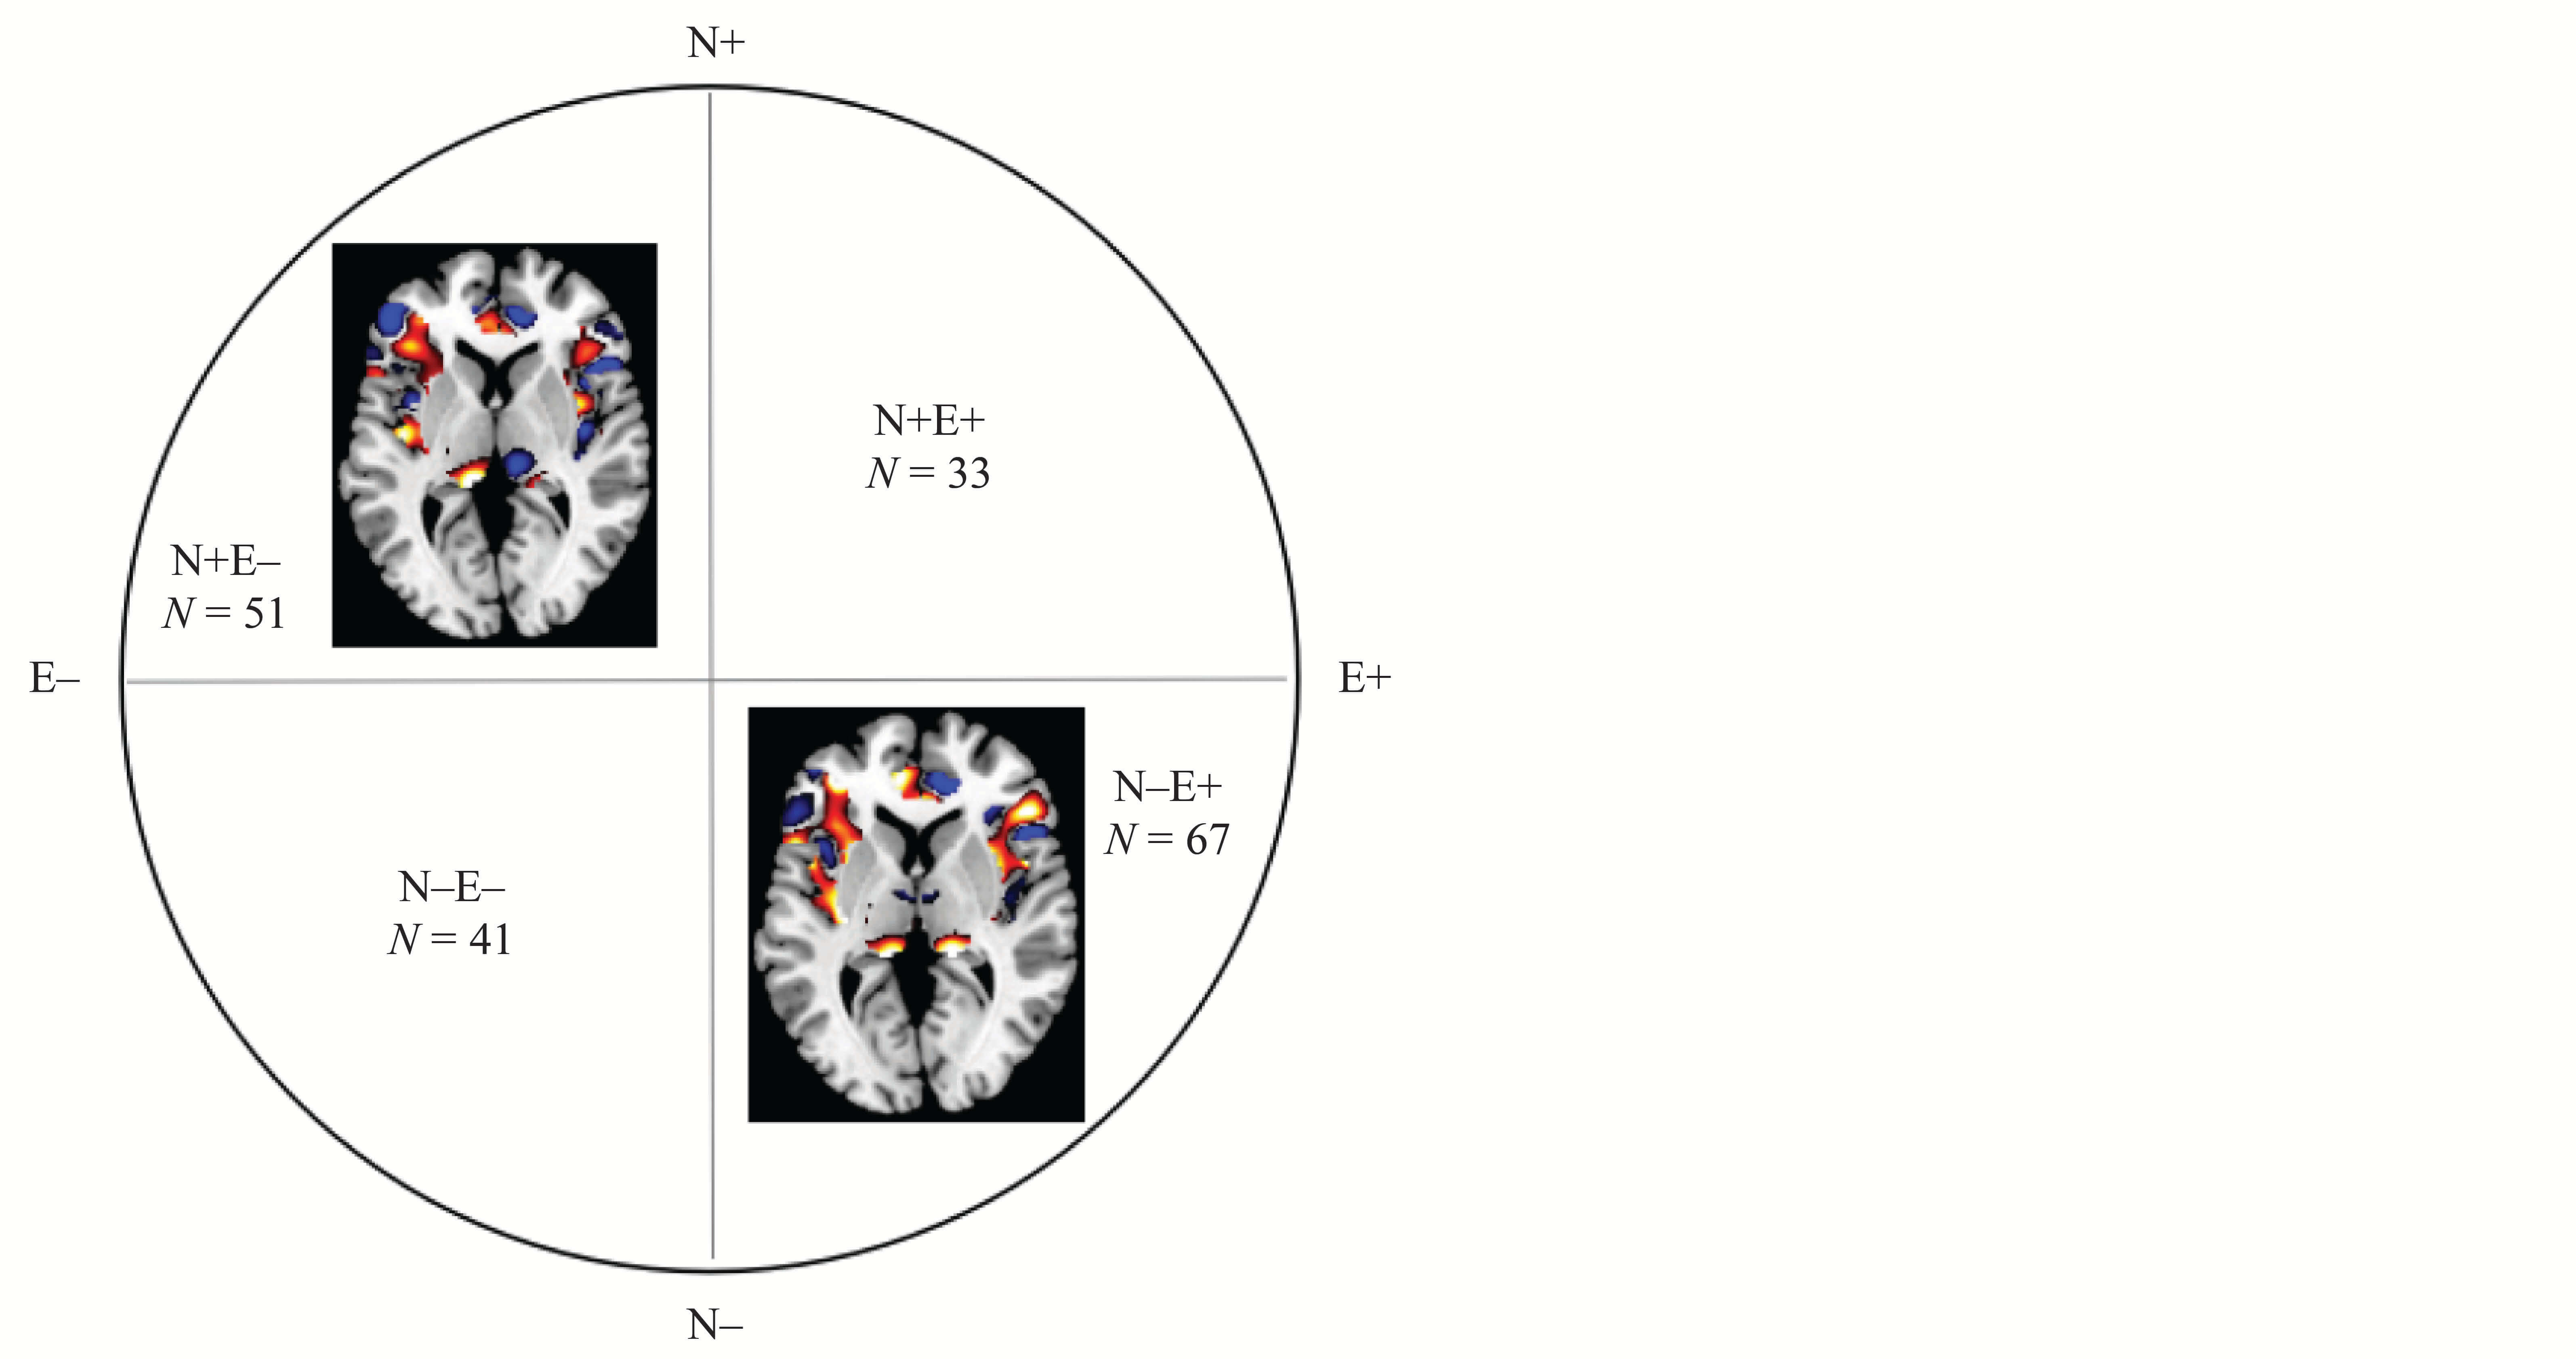
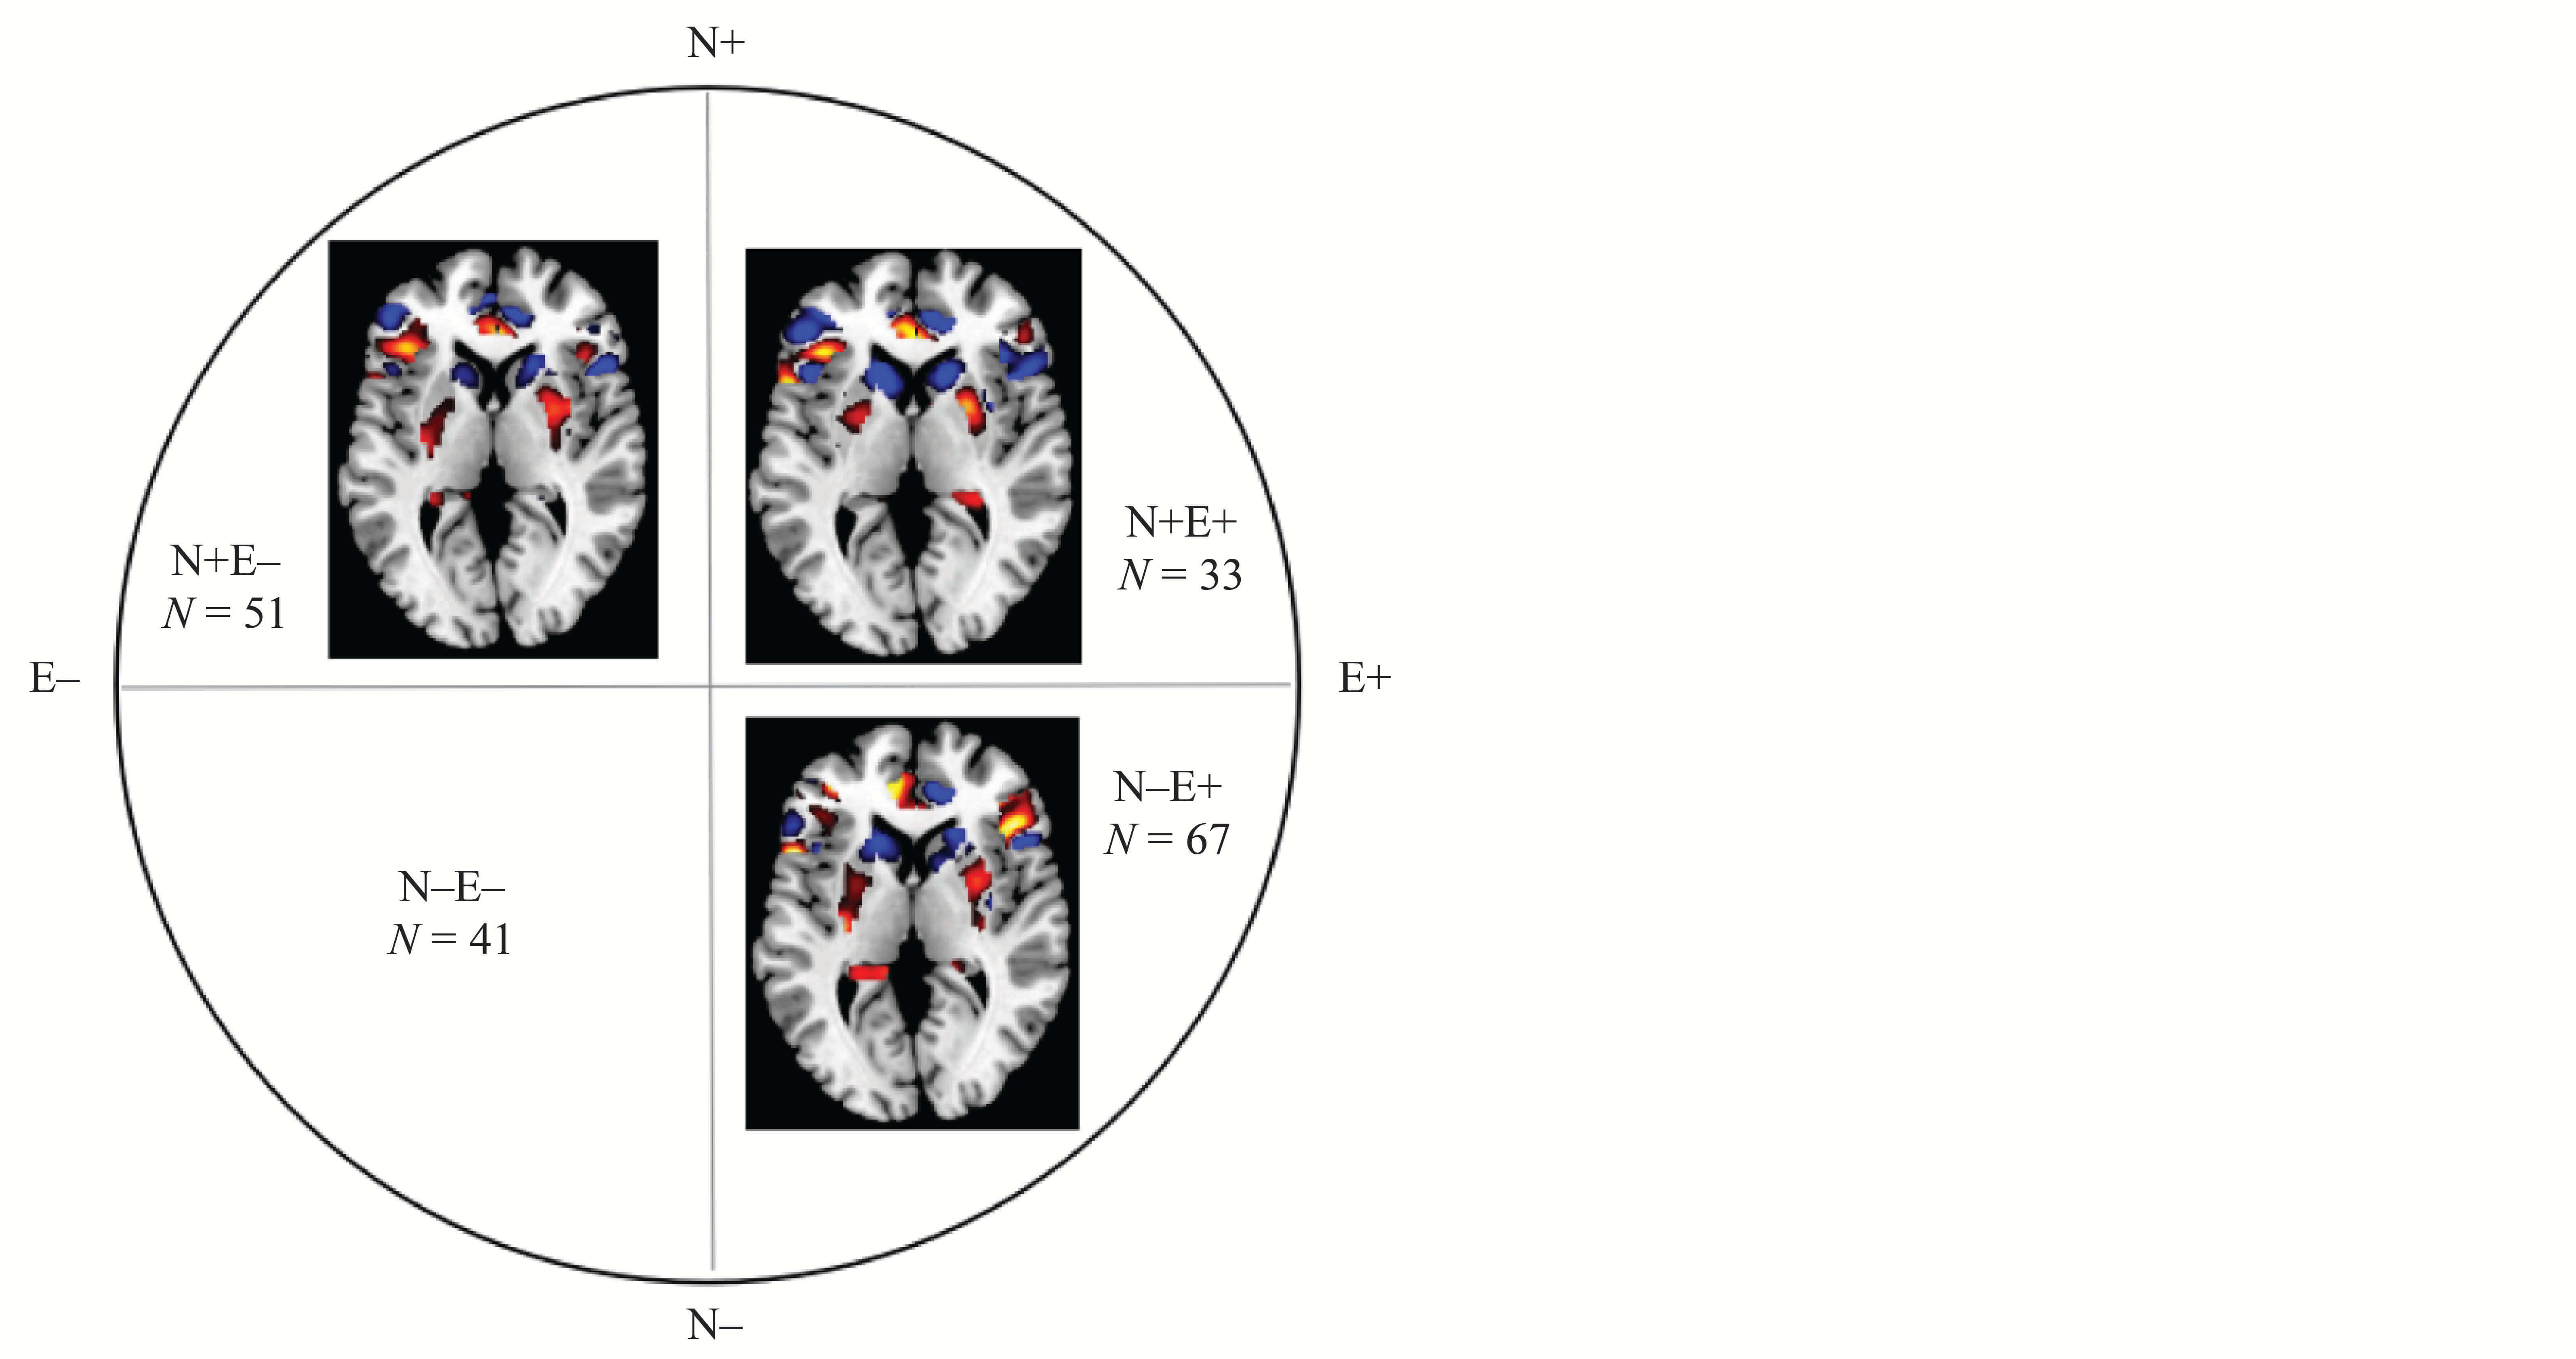
Personality traits are the significant and permanent characteristics of an individual that show a consistent pattern of affect, behavior, thought, and desire over time and space (Burger & Reevy, 2022). Nonetheless, personality styles are person-centered rather than variable-centered aspects, because they place more emphasis on intraindividual differences than on interindividual differences. In contrast to personality traits, personality styles describe an individual’s specific combination of two distinct domains: extraversion and neuroticism (Ashton, 2022; Burger & Reevy, 2022). For instance, people who score low on extraversion and high on neuroticism are known as gloomy pessimists, upbeat optimists score high on neuroticism and low on extraversion, low-key individuals score low on both neuroticism and extraversion, and overly emotional individuals score high on both neuroticism and extraversion (Weiss et al., 2009). Those with higher levels of neuroticism (recognized as the global personality factor anxiety) tend to experience negative emotions when confronted with negative events (e.g., stress and conflict) and exhibit poorer behavioral regulation, whereas individuals who demonstrate extraversion are susceptible to positive emotional states (Ghasemi et al., 2022). Thus, the development of affective illnesses like depression and social anxiety disorder may be facilitated or hindered by neuroticism or extraversion, respectively (Ramos-Grille et al., 2020). Studies of brain structure and function from the perspective of a single personality dimension (e.g., neuroticism) cannot explain the individual essence of anxiety or depression. To properly examine personality styles and the response to the external environment, other factors need to be considered as well. However, the meaning of personality combinations that correspond to brain patterns is not yet clear.
Neuroticism and extraversion are regulated by distinct regions in the brain. Previous studies have associated neuroticism with the ventromedial prefrontal cortex, right anterior cingulate cortex, insula, amygdala, middle temporal lobe, basal ganglia, and frontal gyrus (Belcher et al., 2014; Shackman & Fox, 2021). These regions have been found to be primarily responsible for emotion recognition, evaluating the emotional meaning of stimuli, and generating emotional states, especially in response to aversive and threatening stimuli (Lin et al., 2023; Yang et al., 2023; Yarkoni, 2015). Moreover, brain systems involved in extraversion are more likely to include the mesencephalon (substantia nigra and ventral tegmental region) together with the striatum, frontal cortex, amygdala, and hippocampus, which process social information and social rewards (Ide et al., 2020; Lai et al., 2019; McNaughton, 2020). However, these studies investigated the personality dimensions separately, and the relationships between brain structure and emotion-related personality styles remain poorly understood.
Neuroticism and extraversion are considered stable and can indicate the underlying structure of psychological processes (Hsu et al., 2018). For instance, when confronted with potentially stressful situations, people with high neuroticism and low extroversion develop distress, anxiety, and depression because of their weaker adaptive coping and adjustment methods (Bonsaksen et al., 2019). In general, individuals with low extroversion have fewer social resources than do those with high extraversion, resulting in a greater susceptibility to negative behaviors and emotional states such as suicidal thoughts, anxiety, depression, and excessive smoking and drinking (Perry et al., 2018). Multivariate and mass univariate methods can distinguish the different personality styles in complementary ways by analyzing different brain structures. For example, univariate analysis methods such as support vector machines (SVM) can report differences at the group level. As a form of machine learning, SVM can classify individual data into a certain group (e.g., high neuroticism and high extraversion) based on a classification algorithm developed during training. In contrast, multivariate pattern analysis is sensitive to spatially distributed effects and thus can make inferences at the individual level (Orrù et al., 2012), enabling distinctions based on structural or functional (MRI) data (De Martino et al., 2008). Thus, we combined mass univariate and multivariate methods to investigate, identify, and predict the features of the brain structure in 192 individuals with different personality styles.
On the basis of previous findings (Belcher et al., 2014; Bjørnebekk et al., 2013; Deng et al., 2019; Lin et al., 2023; Yarkoni, 2015), this study explored whether there are behavior differences among different personality styles, for example, whether individuals with high neuroticism and low extraversion tend to have anxiety symptoms, while individuals with low levels of both neuroticism and extraversion are more sensitive to anticipating reward and punishment. We predicted that there would be certain important brain structure differences among different personality styles, while not expecting these differences to classify personality styles in isolation. Enhancing knowledge about the combination of these differences in brain structures and related brain areas of neuroticism and extraversion will greatly improve the prediction effect of personality styles.
Method
Participants and Procedure
We used convenience sampling to recruit 192 college students without cognitive impairment from Southwestern University. Participants completed questionnaires at Southwestern University’s Brain Imaging Center before completing MRI scans. It took about 1.5 hours for each participant to complete the test. Prior to taking part in the study on a voluntary basis, all participants provided written informed consent. The research satisfied the guidelines set forth in the Declaration of Helsinki (1991) and received approval from the Institutional Review Board at the Southwestern University Center for Brain Imaging. Participants’ ages ranged between 17 and 27 years (M = 19.9, SD = 1.3), and there were 105 men and 87 women.
Measures
Neuroticism and Extraversion
Depression
Anxiety
Sensitivity to Punishment
Magnetic Resonance Imaging Acquisition
We acquired high-resolution T1-weighted anatomical images using a Siemens Trio MRI scanner operating at 3.0 T with an eight-channel coil (Siemens Medical in Erlangen, Germany) and a magnetization-prepared rapid gradient echo sequence (TR = 1900 ms, TE = 2.52 ms, TI = 900 ms, flip angle = 9°, 176 slices with a thickness of 1.0 mm, resolution matrix = 256 × 256, voxel size = 1 × 1 × 1 mm3). Earplugs and foam pads were used to diminish scanner noise and minimize head motion. The participants were instructed to shut their eyes, stay alert, and keep their mind clear.
Voxel-Based Morphometry Preprocessing
To process the MRI images, we used SPM8 (Wellcome Department of Cognitive Neurology, London, UK), which was implemented in MATLAB 7.8 (MathWorks Inc., Natick, MA, USA). In SPM8, anatomic abnormalities or artifacts are first examined, which is followed by the identification of gray matter, white matter, and cerebrospinal fluid in the image using the new segmentation toolkit. Differential anatomical registration is then used for registration, normalization, and modulation using exponential Lie (DARTEL) algebras (Ashburner, 2007). Last, the normalized modulated images (gray- and white-matter images) were smoothed using a 10 mm full width at half-maximum Gaussian kernel to improve the signal-to-noise ratio.
Support Vector Machine
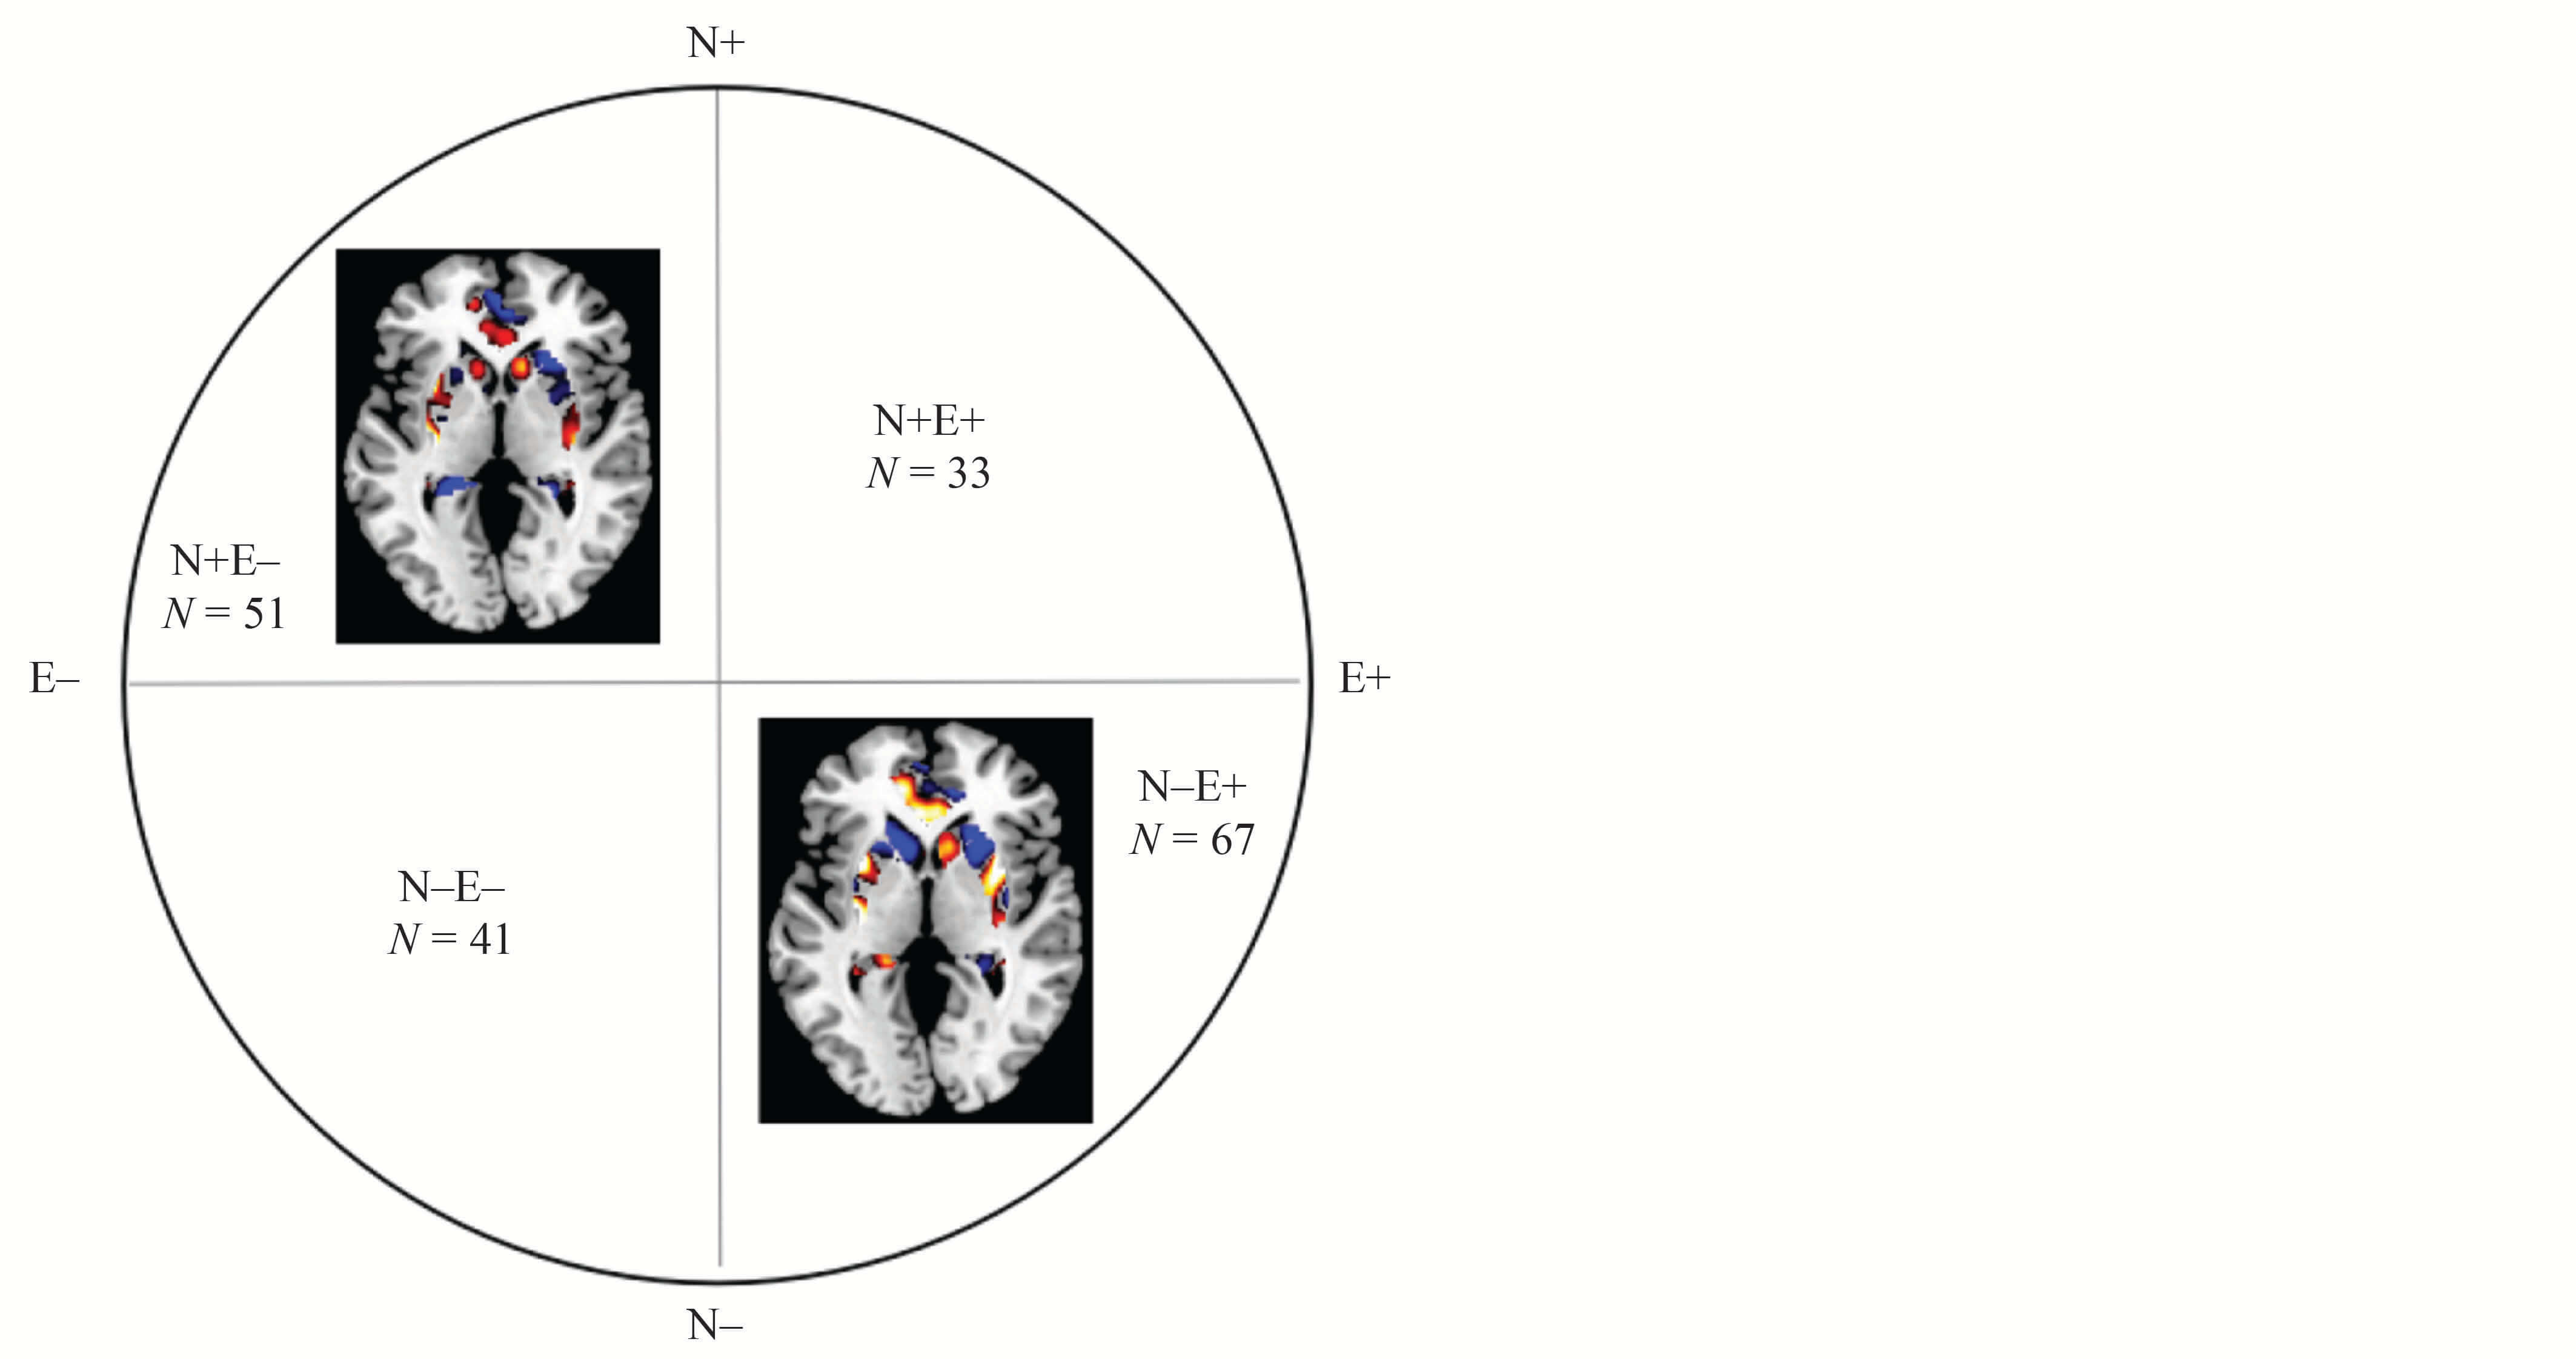
After preprocessing, we used SVM (Burges, 1998) as implemented in the PROBID software package to investigate the potential of whole-brain structural MRI images to discriminate amongst the four personality styles groups (based on the median neuroticism and extraversion scores). Across four personality styles, we obtained the following scores for neuroticism (N) and extraversion (CE): N+E+ 142–167, 153–195; N+E– 143–184, 113–152; N–E+ 90–141, 153–199; N–E– 89–142, 105–153. For pattern classification analysis of the brain structure data, we followed the approach of Schrouff et al. (2013) and used the PRoNTo toolbox for both the training and testing steps. During the training phase, the algorithm found a hyperplane that divided the training samples in the input space according to their class labels. Once the decision function was trained using the training set, it predicted the group membership of test subjects. We used cross-validation on each participant to separate the test data set from the training set by mean centering and omitting one. Finally, to assess the statistical significance of the findings, we conducted a random permutation test 5,000 times.
Data Analysis
We used SPSS 13.0 to evaluate all behavioral data and a generic linear model to statistically analyze the MRI data. The five dimensions of the Revised NEO Personality Inventory subscale were included as covariates of interest to examine the anatomical correlates of group differences in personality styles; the influence of gender, age, and total gray matter volume were considered as factors of no interest. We set the voxel-wise intensity threshold at p < .05 to execute a multiple comparison correction, and computed a cluster-level threshold using Monte Carlo simulation and the AlphaSim tool in Analysis of Functional Neuro Images (Ward, 2000). Last, FSLviewer was used to present the results.
Results
Behavioral Results
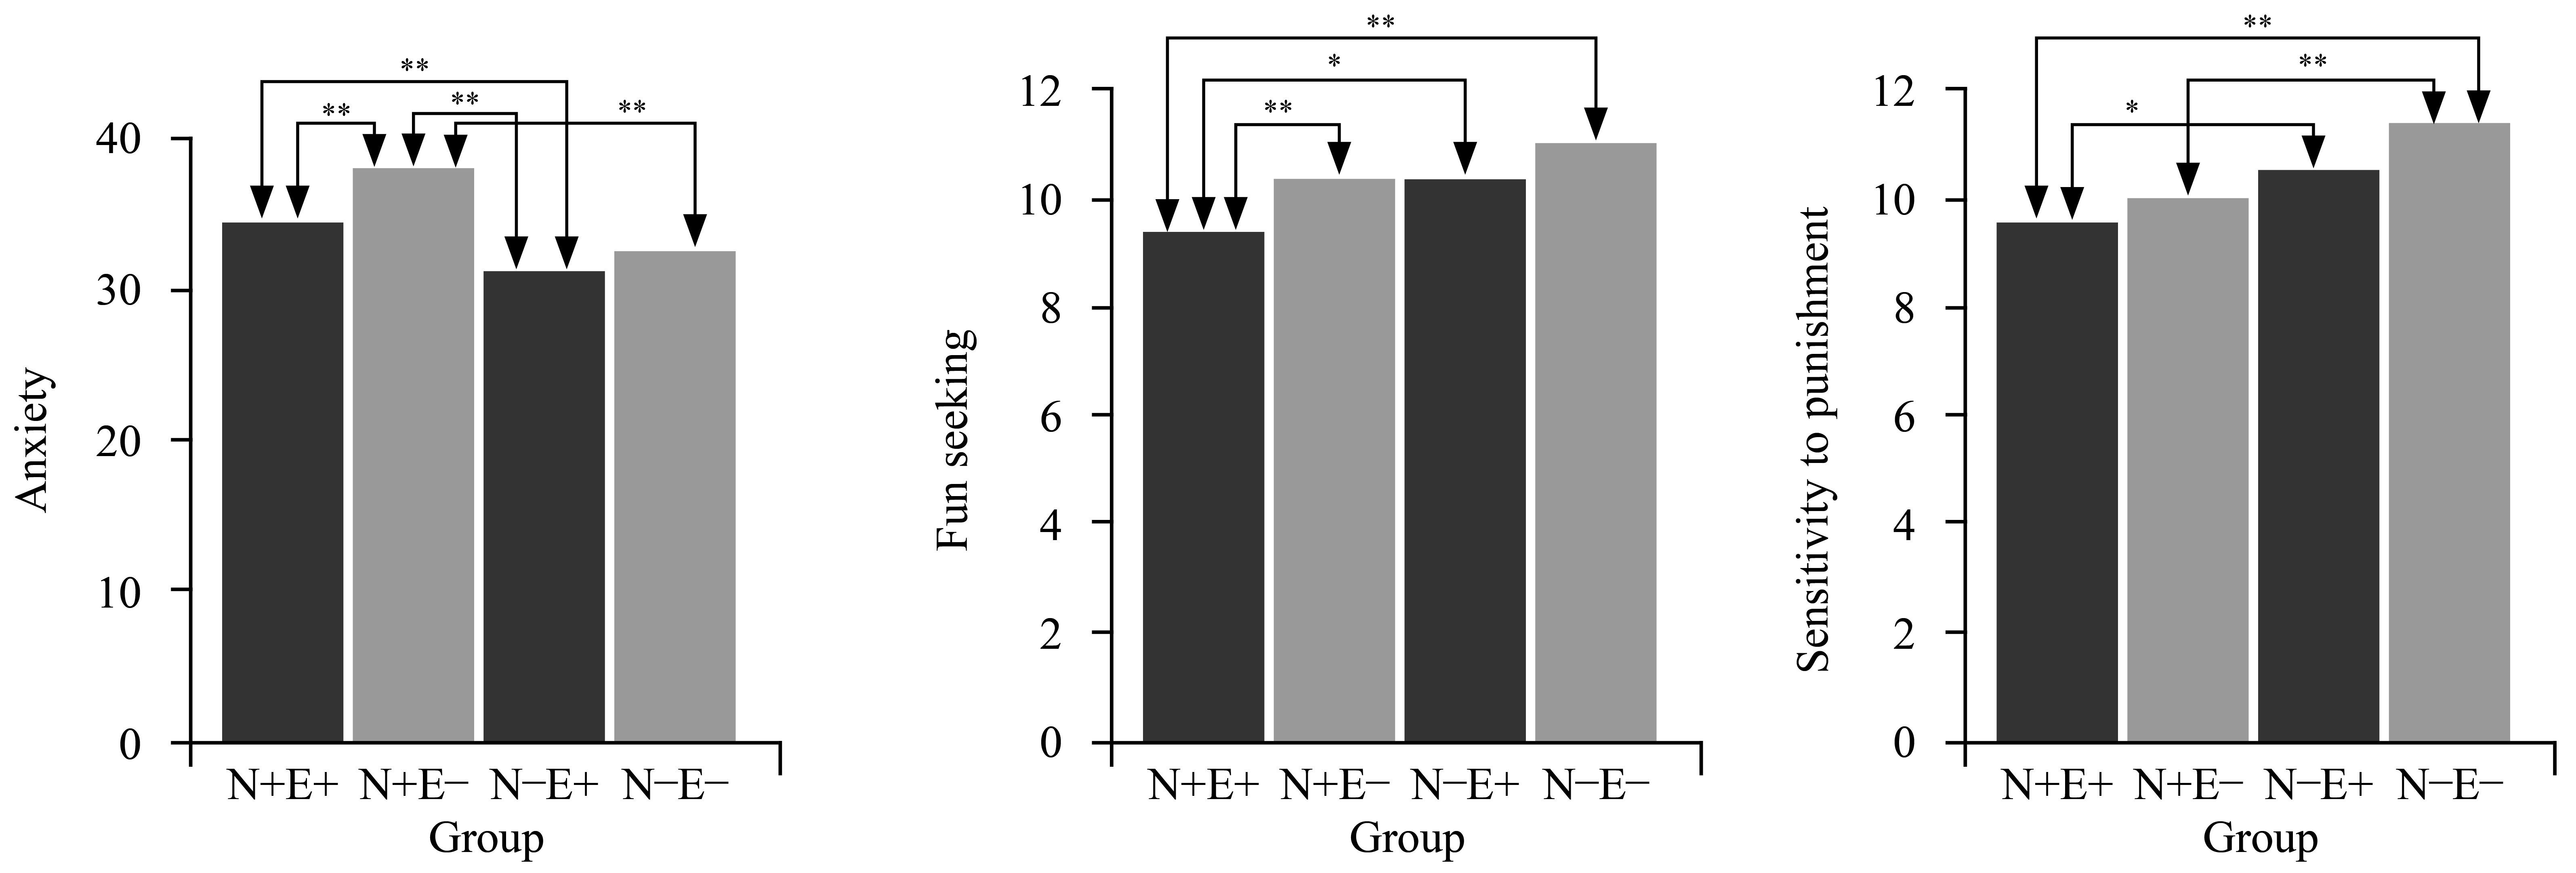
Regarding the epidemiological measures (age and gender), there were no appreciable variations among the four groups. However, on the SAS, the N+E– group scored higher than the N+E+ group (t = 3.02, p < .05), the N–E+ group (t = 6.68, p < .001), and the N–E– group (t = 5.34, p < .001), while the N+E+ group scored higher than the N–E+ group (t = 2.95, p < .05). On the SDS, the N+E+ group scored higher than the N–E+ group (t = 3.02, p < .05) and the N–E– group (t = 3.03, p < .05), while the N+E– group scored higher than the N–E+ group (t = 3.49, p < .001) and the N–E– group (t = 3.58, p < .001). For fun seeking, the N+E+ group scored lower than the N+E– group (t = –2.24, p < .05), the N–E+ group (t = –2.13, p < .05), and the N–E– group (t = –3.04, p < .001). On the BIS, the N+E+ group scored lower than the N–E+ group (t = –2.18, p < .05) and the N–E– group (t = –3.11, p < .05); further, the N+E– group scored lower than the N–E– group (t = –2.58, p < .05). For details, see Table 1 and Figure 1.
Table 1. Participants’ Demographic Details and Descriptive Statistics for Study Variables
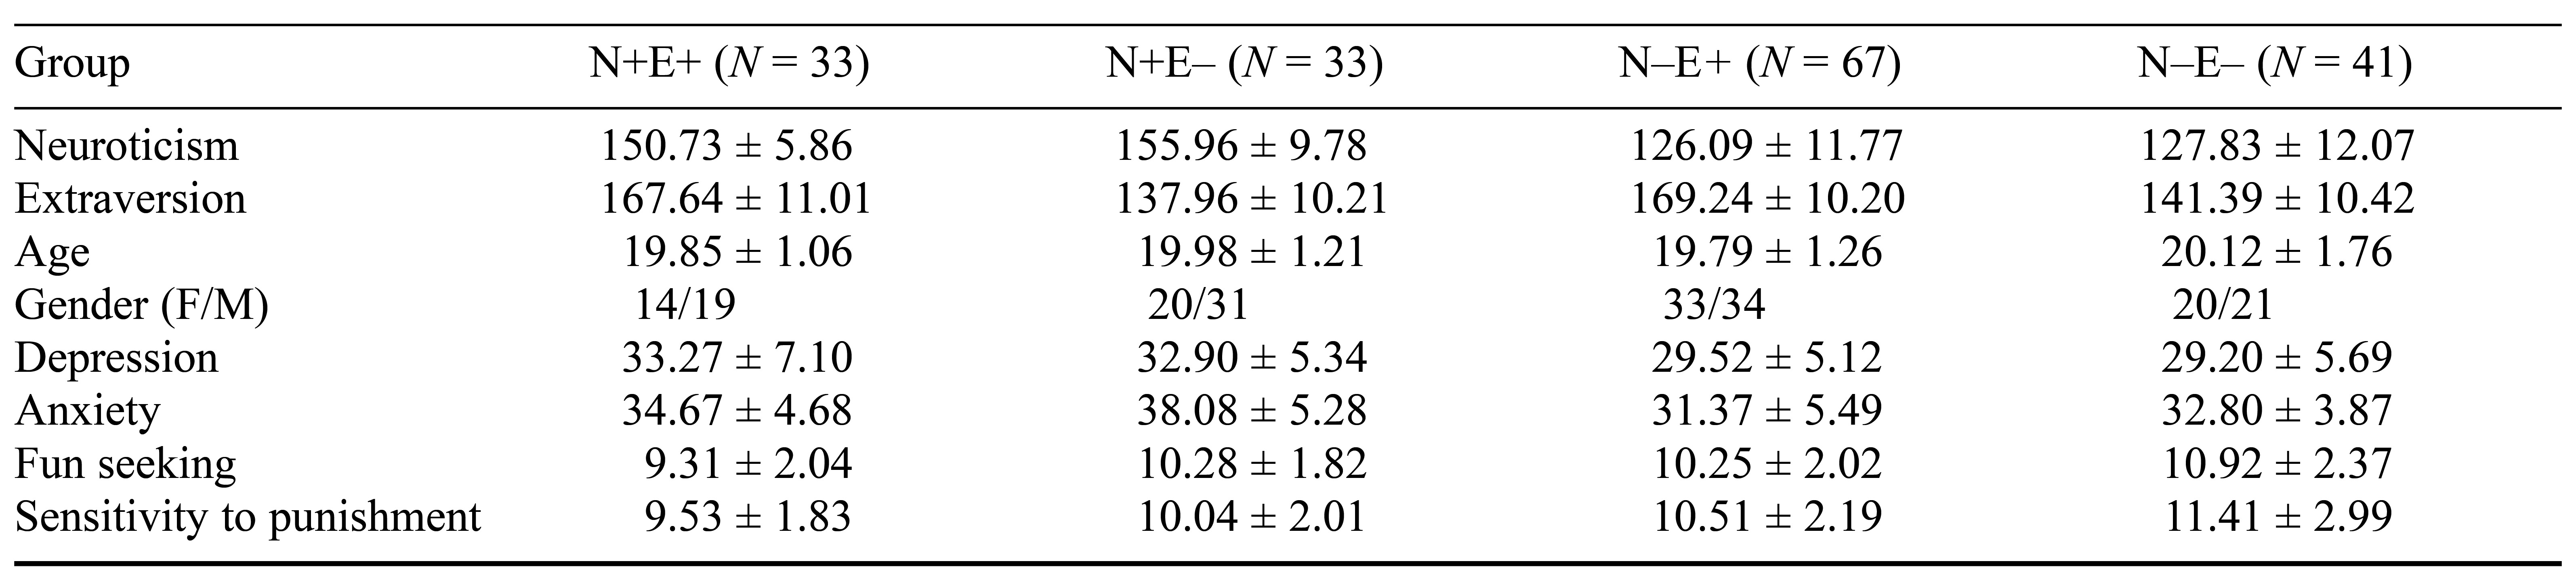
Note. F = female; M = male; N = neuroticism; E = extraversion.
Multivariate Pattern Analysis Results According to the Candidate Brain Region Involved in Neuroticism and Extraversion
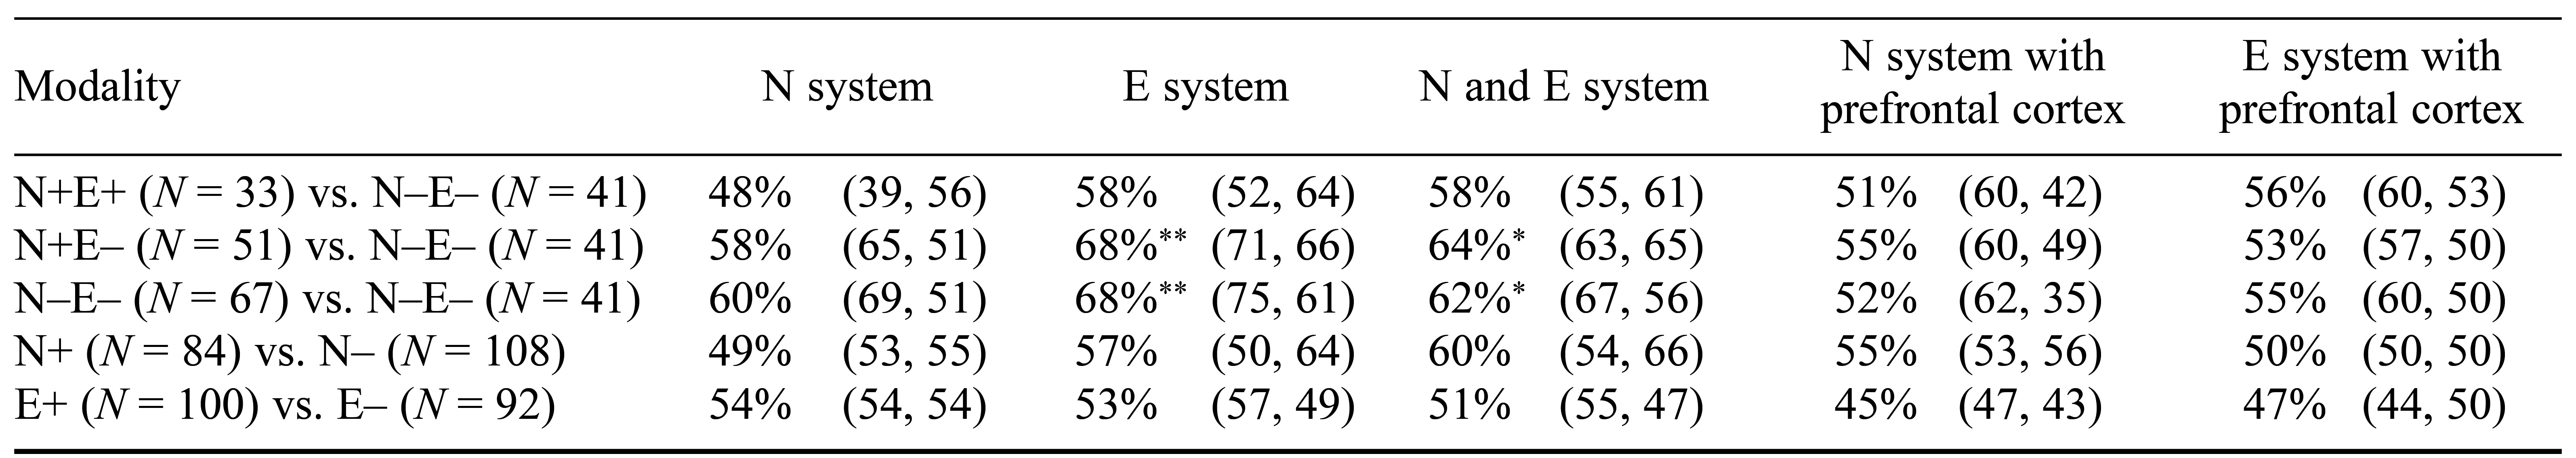
Using multivariate pattern analysis, we looked further into the individual-level predictive power of regional gray matter volume according to the most promising potential brain region engaged in N and E, where the common frontal cortex has been mistakenly identified and thus ruled out. The applications of SVM to the E system classified N+E– and N–E– with 71% and 66% sensitivity (overall accuracy = 68%), while N–E+ and N–E– were classified with 75% and 61% sensitivity (overall accuracy 68%) in all participants. Moreover, personality traits (N and E) could not be discriminated with the candidate brain region involved in the N or E system. The permutation testing indicated that such accuracy was statistically significant (p < .05; refer to Tables 2 and 4, and Figure 2).
Table 2. Balanced Prediction Accuracy for Personality-Style Classifiers of Neuroticism System, Extraversion System, and Prefrontal Cortex Masks
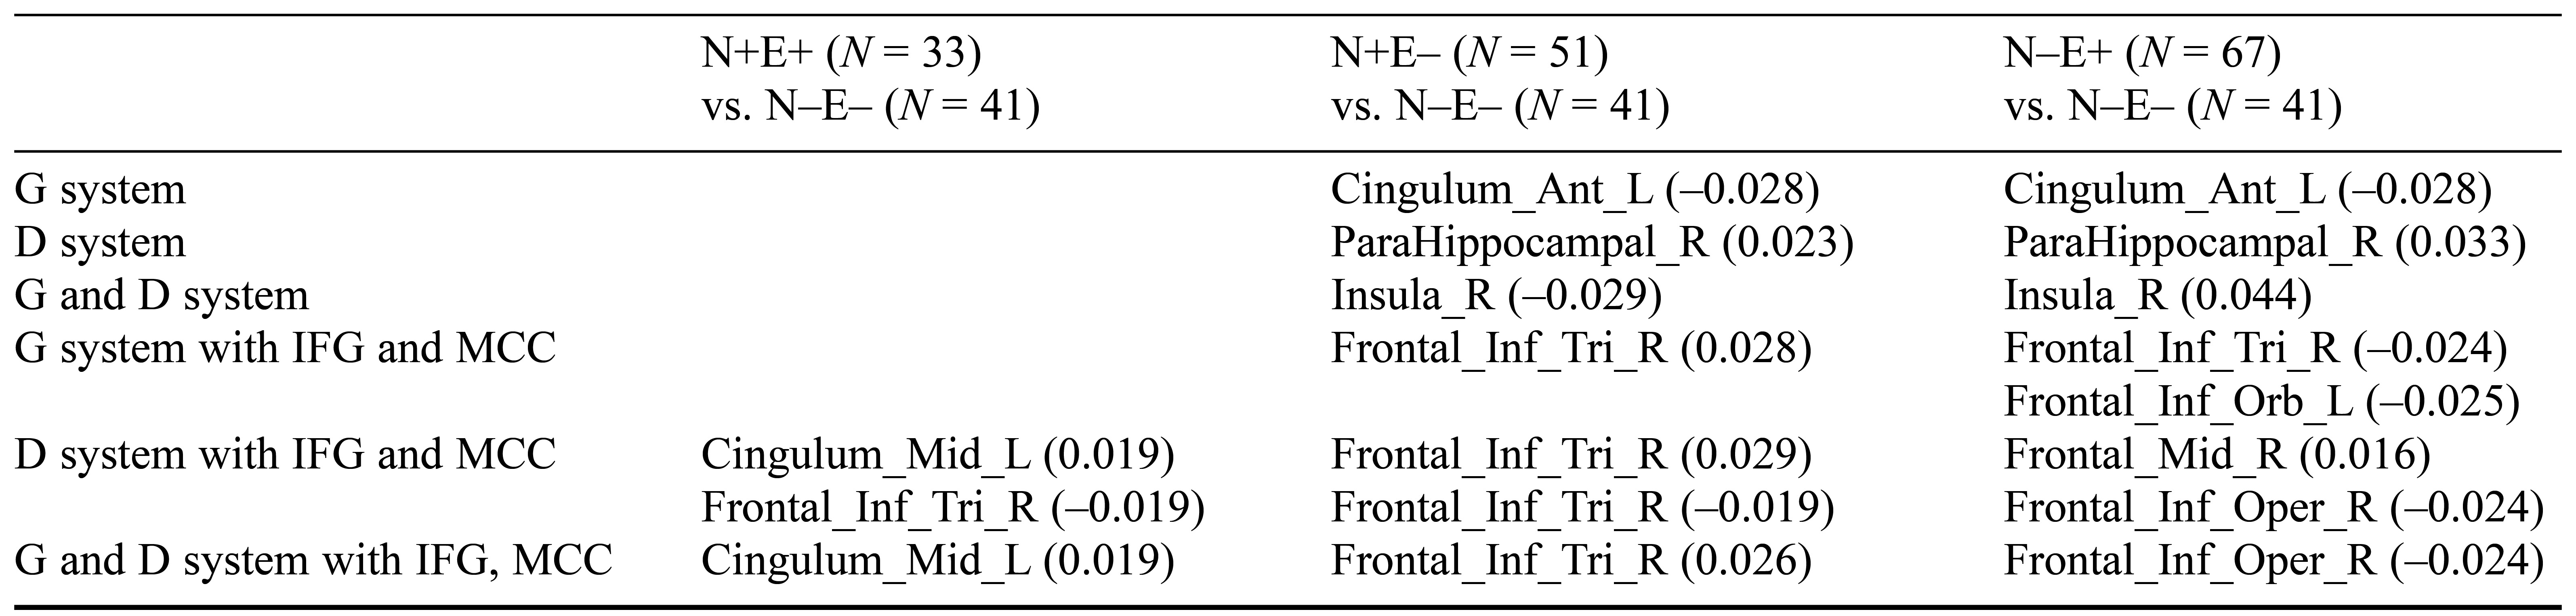
The glutamatergic system is composed of the cingulum_ant, amygdala, thalamus, and insula, which are related to neuroticism. The dopaminergic system is composed of the cingulum_ant, amygdala, striatum, and hippocampus, which are related to extraversion (Pauli et al., 2013).
Voxel-Based Morphometry Results of Univariate Analysis
We investigated the differences between the four groups by conducting a one-way analysis of variance. Covariates of no interest that were regressed out included gender, age, and the total gray matter volume of individual brains. Using the 3dClustSim (Analysis of Functional Neuro Images) tool, multiple comparison correction served as the foundation for statistical inference. This analysis showed a larger left inferior frontal gyrus and smaller left midcingulate cortex in the N–E– group compared to the N+E–, N–E+, and N+E+ groups (for details, see Figure 3).
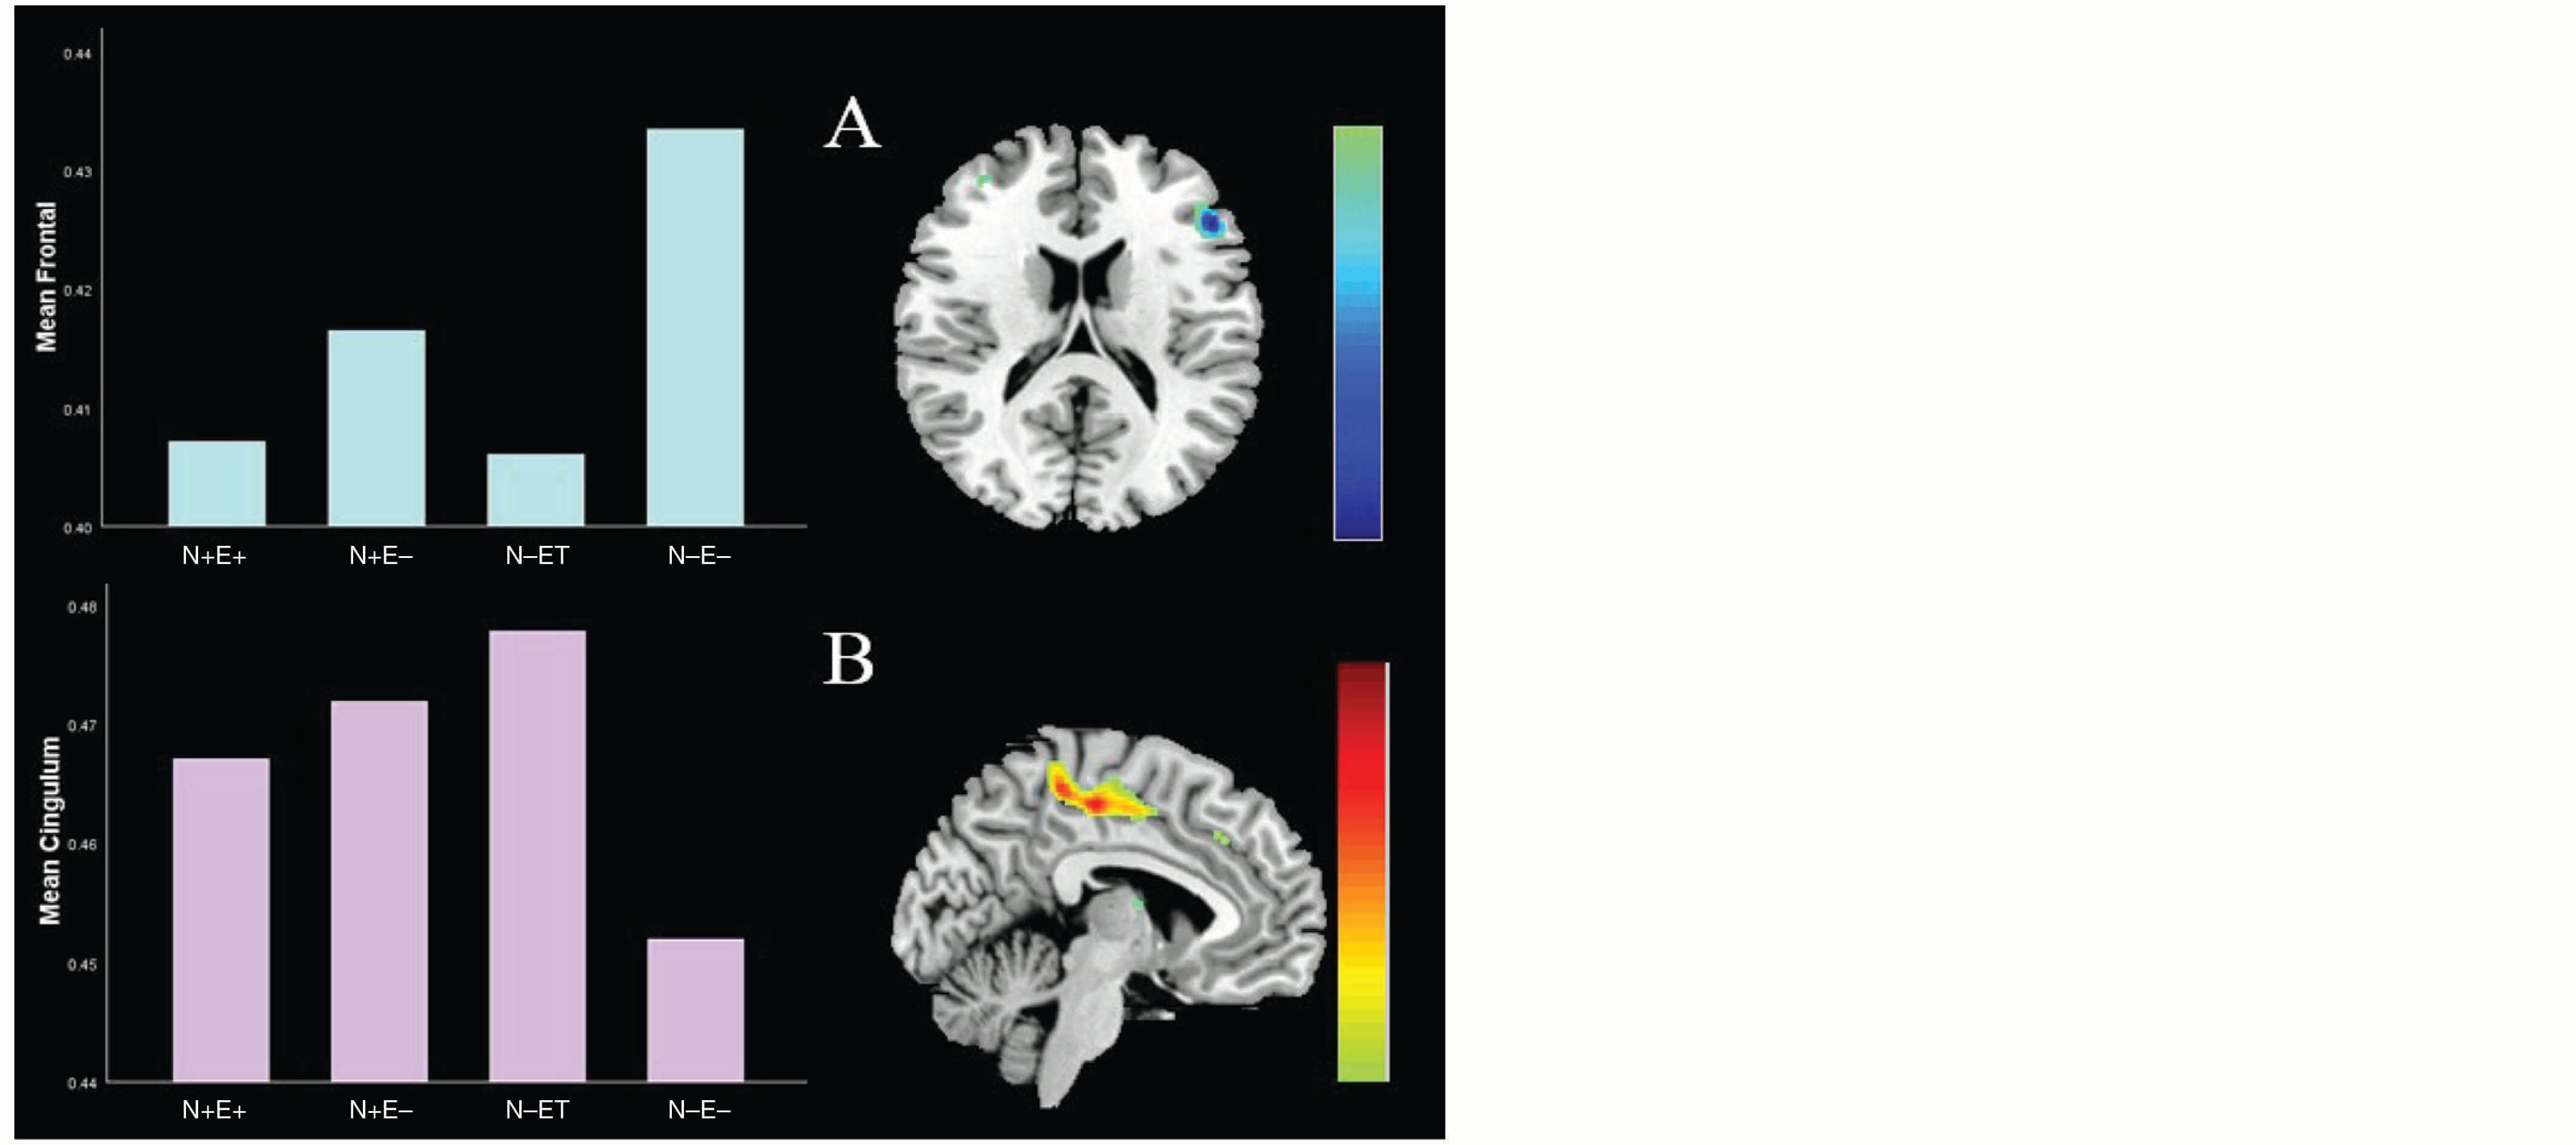
Figure 3. Group Differences in Brain Structure in the Left Inferior Frontal Gyrus and Smaller Left Midcingulate Cortex
The combined threshold corrected by the AlphaSim program in Analysis of Functional Neuro Images was p < .05 for each voxel, and the cluster size was > 798 voxels (significant at p < .01).
Multivariate Pattern Analysis Results According to the Candidate Brain Region Involved in Neuroticism, Extraversion, and Voxel-Based Morphometry
On the basis of the potential brain areas implicated in N, E, and the voxel-based morphometry outcomes of univariate analysis, we employed multivariate pattern analysis to further explore the predictive power of regional gray matter volume at the individual level. Application of SVM to the inferior frontal gyrus and midcingulate cortex with the N system classified the N+E– and N–E– groups with 67% and 63% sensitivity (overall accuracy = 65%), while the N–E+ and N–E– groups were classified with 79% and 54% sensitivity (overall accuracy = 66%) for all participants. Moreover, the N+E– and N–E– groups were classified with 78% and 68% sensitivity (overall accuracy = 73%) by applying SVM to the inferior frontal gyrus and midcingulate cortex using the E system, while the N–E+ and N–E– groups were classified with 76% and 56% sensitivity (overall accuracy = 66%), and the N+E+ and N–E– groups were classified with 76% and 78% sensitivity (overall accuracy = 77%) for all participants. Furthermore, N and E could not be discriminated with the candidate brain region involved in N or E. According to the results of the permutation test, this accuracy was statistically significant (p < .05; for details, see Figures 4–5 and Tables 3–4).
Table 3. Balanced Prediction Accuracy for Personality-Style Classifiers of Neuroticism System, Extraversion System, Inferior Frontal Gyrus, and Midcingulate Cortex Masks
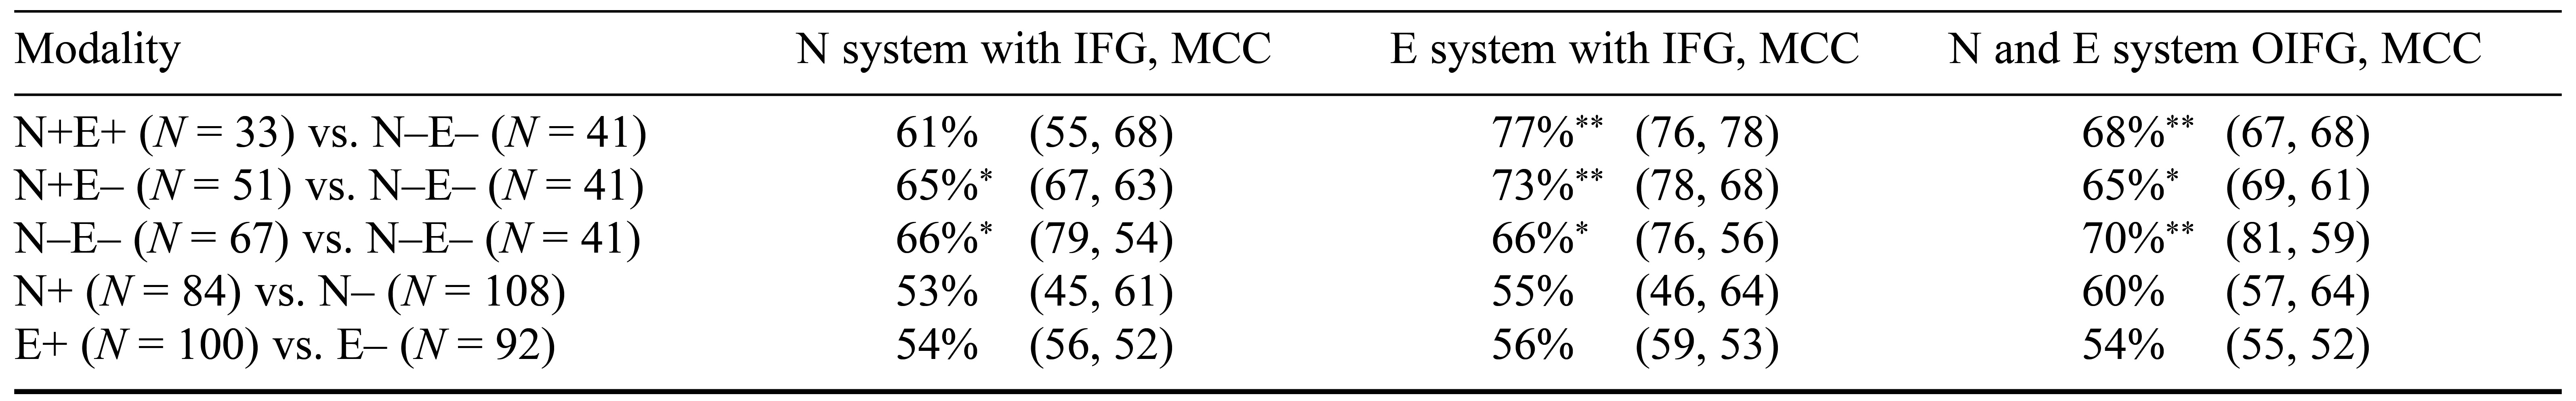
Table 4. Balanced Prediction Accuracy for Personality-Style Classifiers of Glutamatergic System, Dopaminergic System, Inferior Frontal Gyrus, and Midcingulate Cortex Masks
Interaction Effects Between Neuroticism and Extraversion on Gray Matter Volume
The voxel-wise analysis of covariance revealed an interaction effect between neuroticism (low and high) and extraversion on gray matter volume in the left midcingulate cortex (t = 3.83, p < .01; see Figure 6). Extraversion scores were significantly and positively correlated with gray matter volume in low neuroticism (r = .31, p < .01), but significantly and negatively correlated with gray matter volume in high neuroticism (r = –.27, p < .01). Nevertheless, the voxel-wise analysis of covariance analysis revealed an interaction effect between neuroticism and extraversion (low and high) on gray matter volume in the left inferior frontal gyrus (t = –4.55, p < .01; see Figure 6). Neuroticism scores were significantly and positively correlated with gray matter volume in low extraversion (r = .29, p < .01), but significantly and negatively correlated with gray matter volume in high extraversion (r = –.31, p < .01).
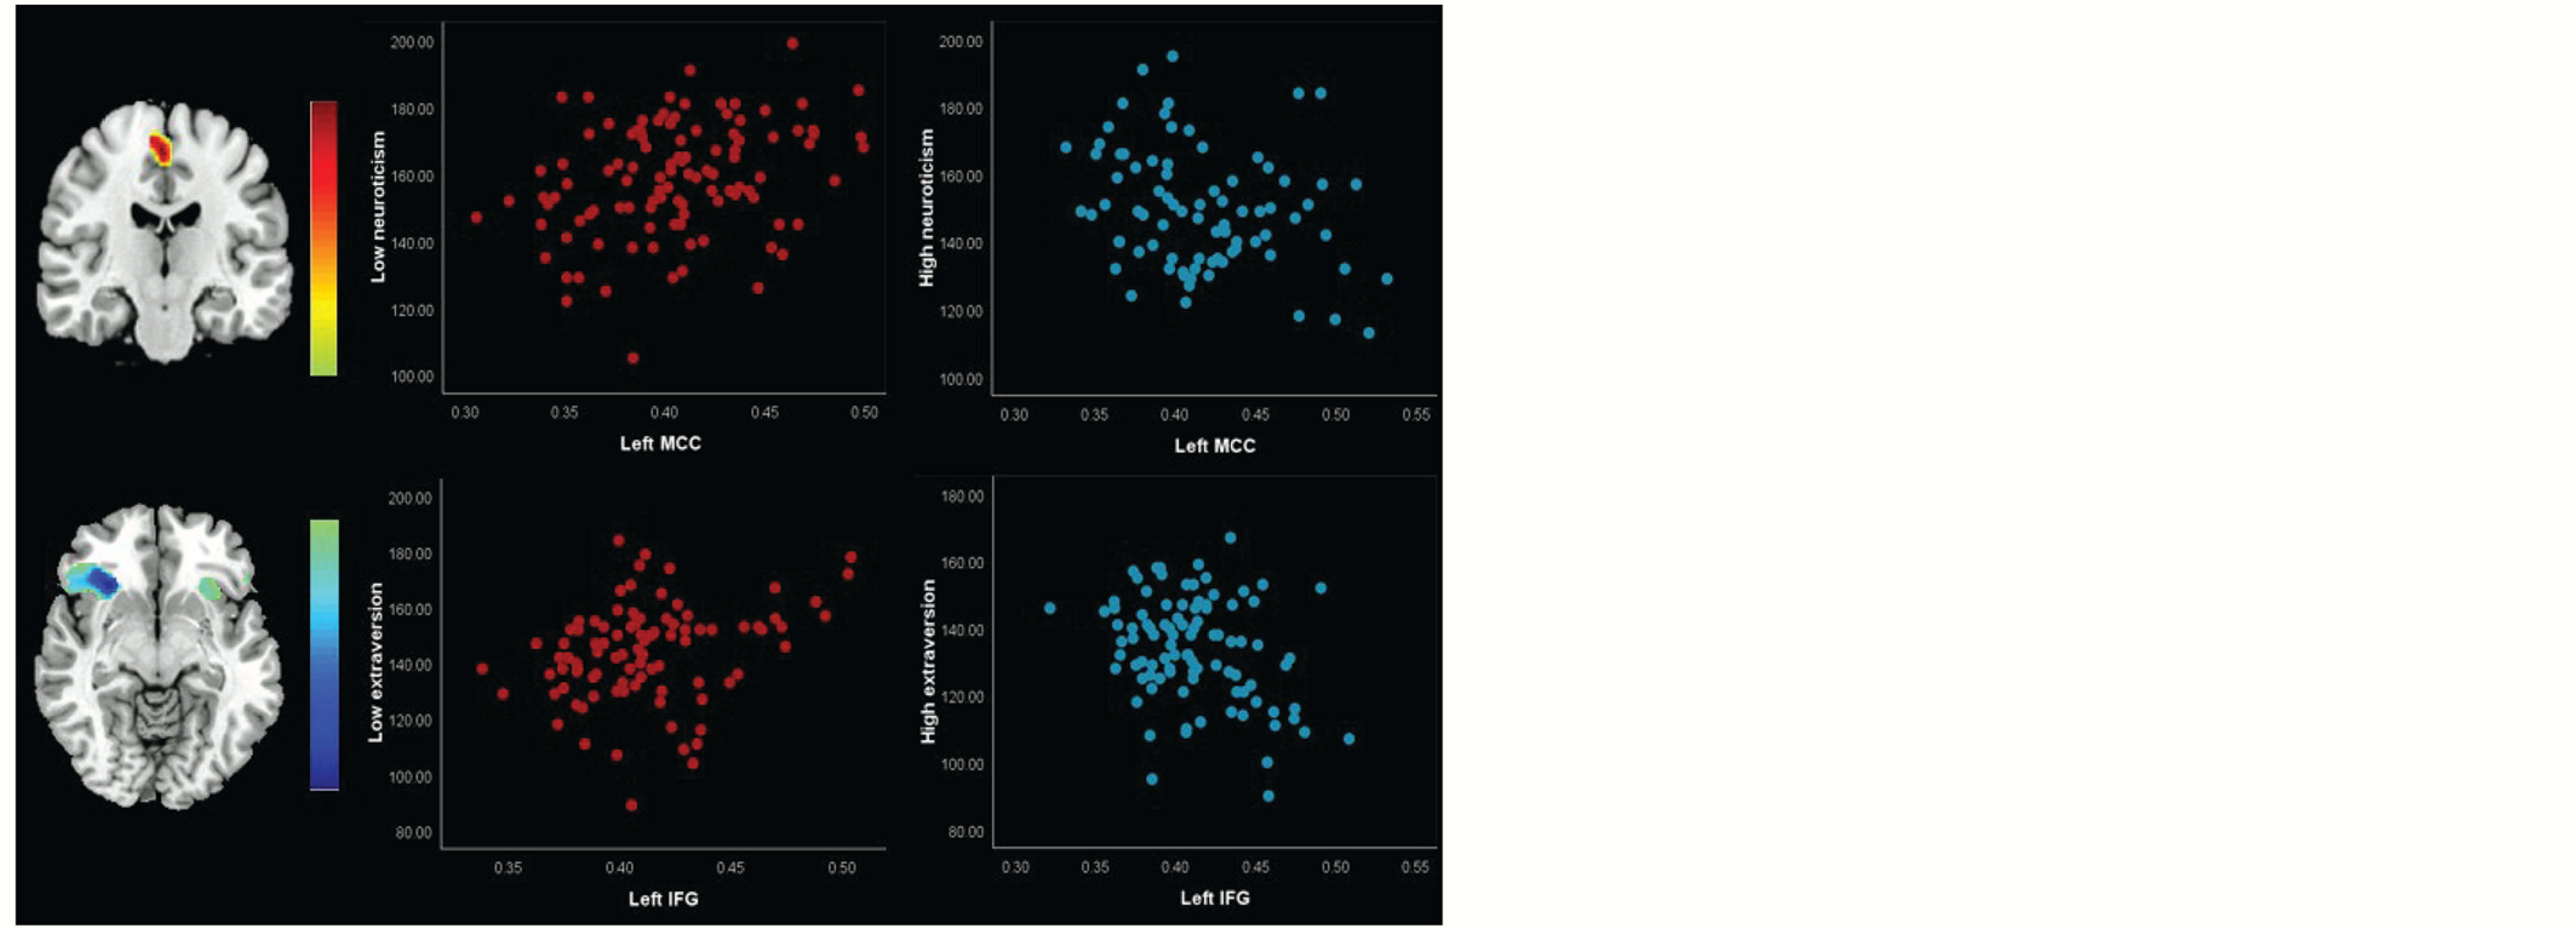
The AlphaSim program’s cumulative threshold correction in Analysis of Functional Neuro Images was p < .05 for every voxel provided that the cluster size >798 voxels. Relationships between neuroticism and extraversion scores and peak voxel gray matter volume values are shown in scatter plots.
Correlations Between Gray Matter Volume and Scores for Depression, Anxiety, and Sensitivity to Reward and Punishment
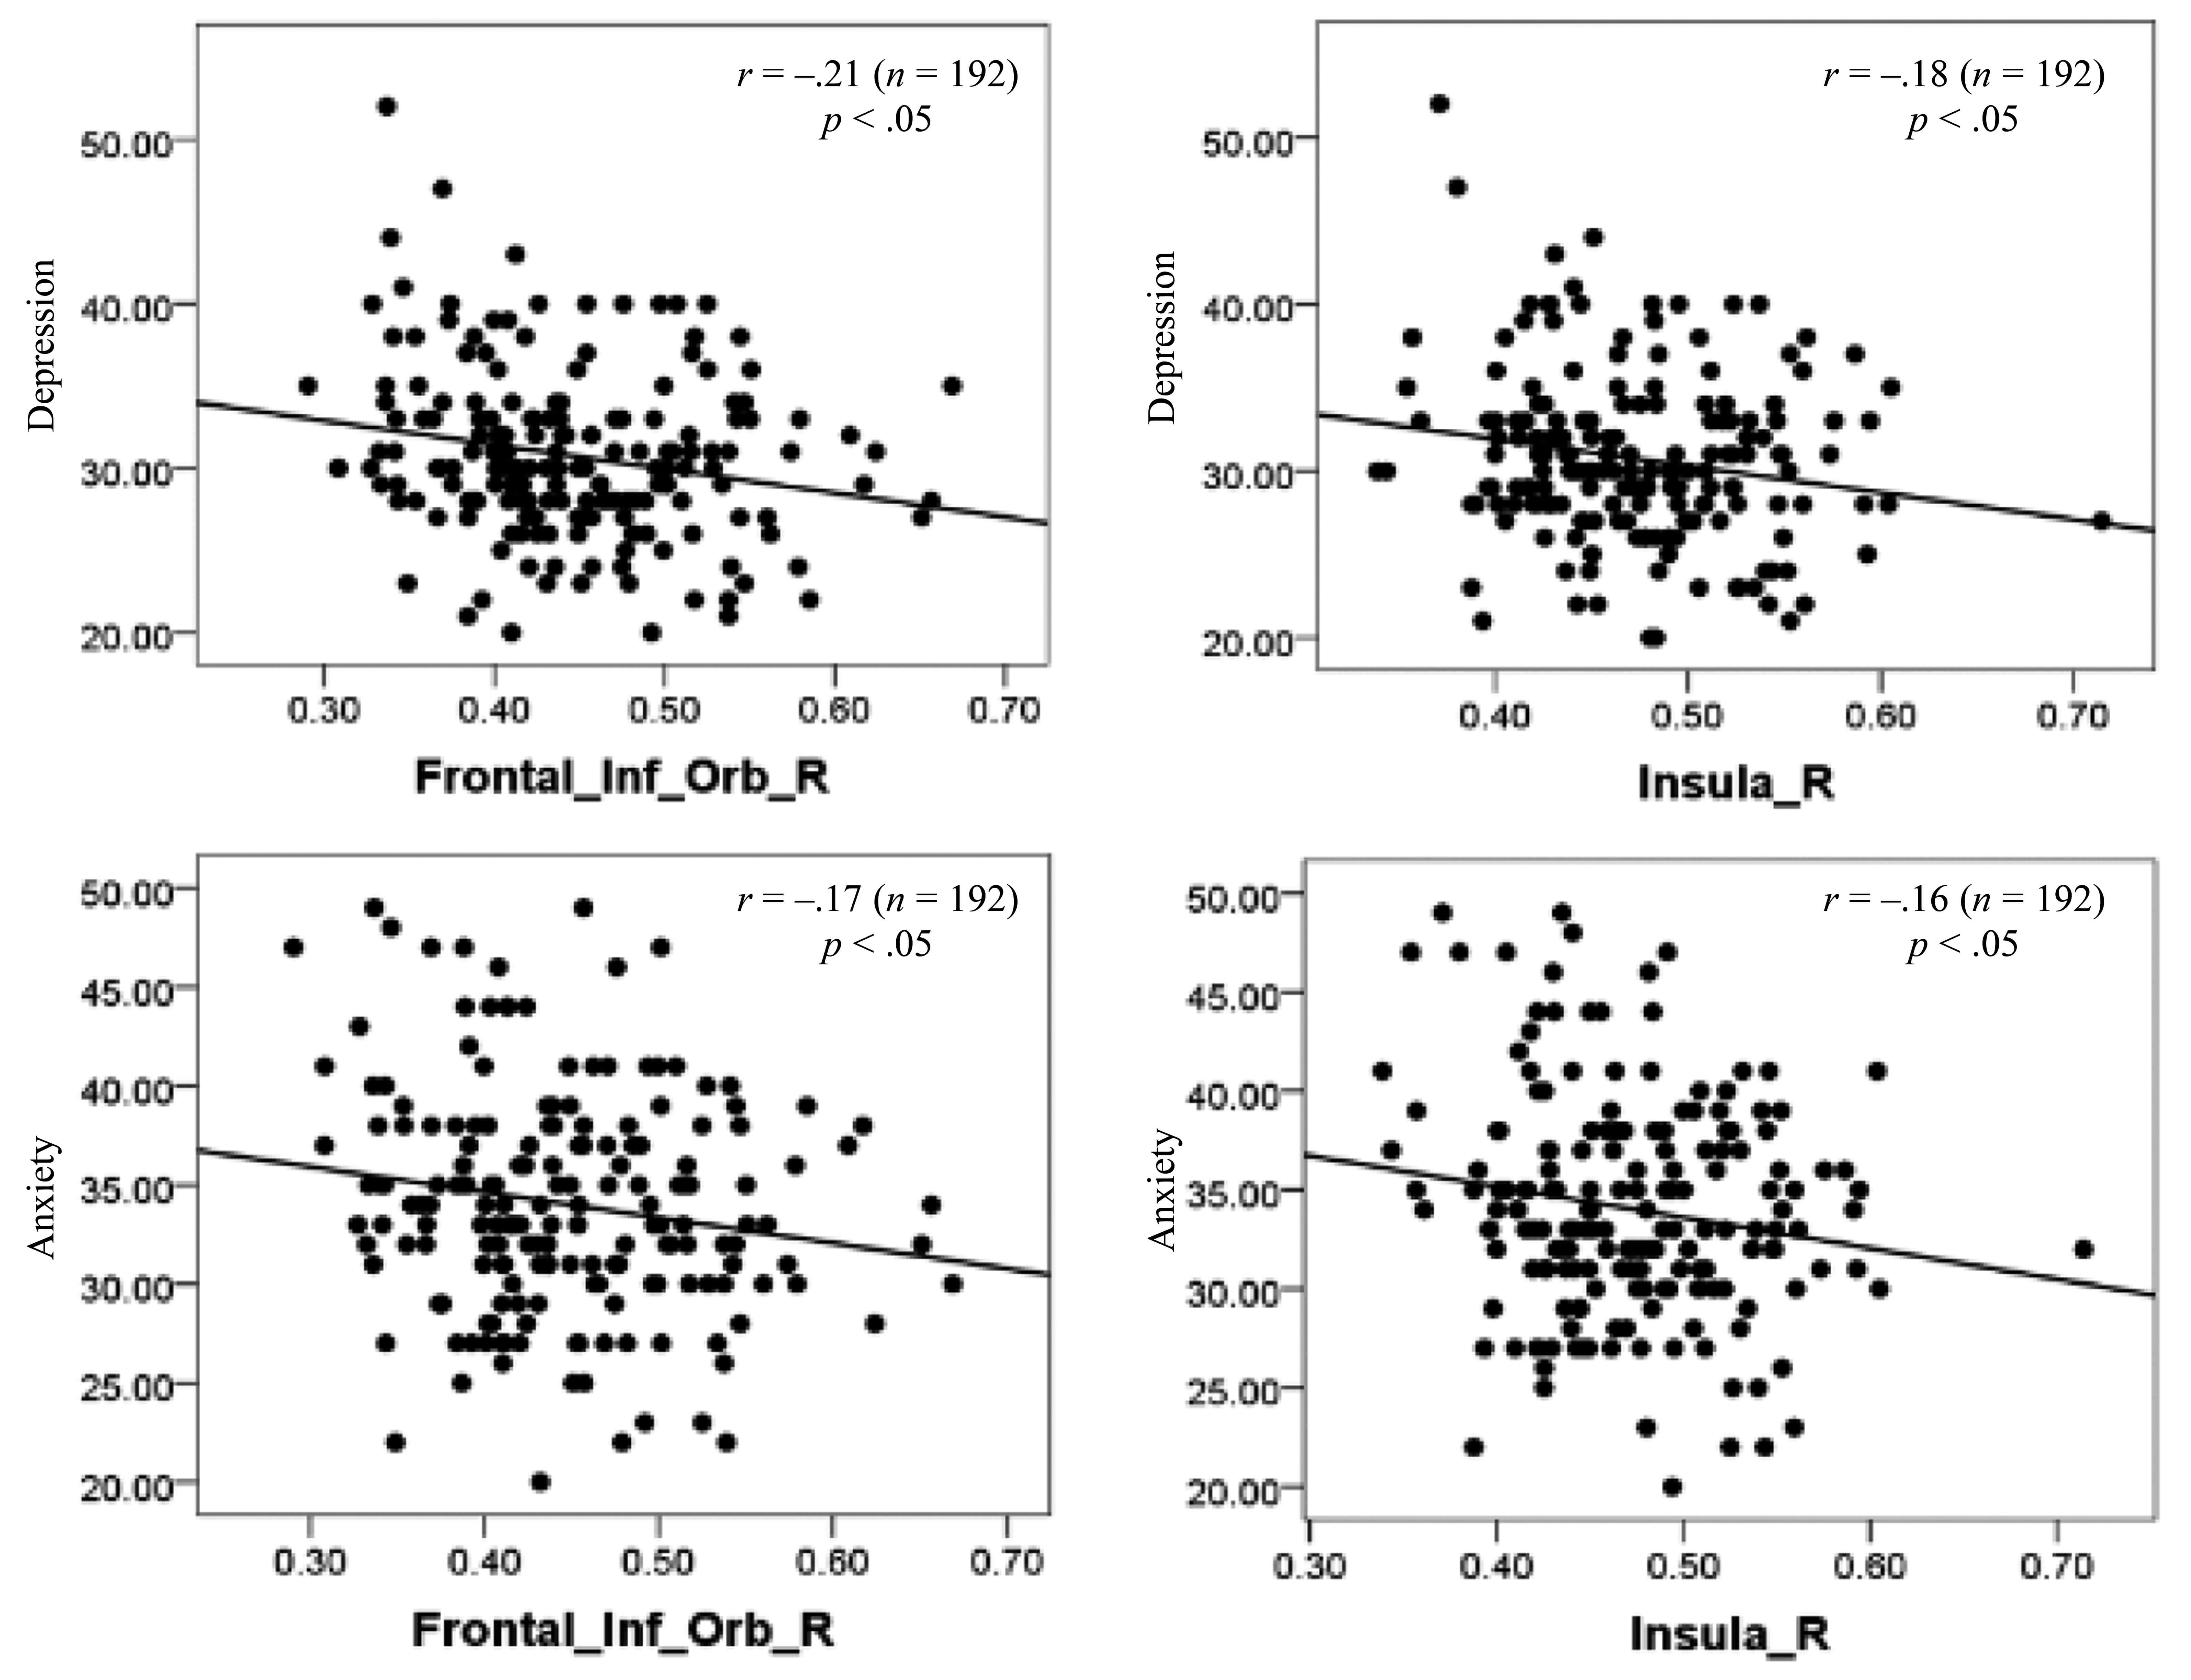
We investigated the relationships between scores on the SDS/SAS/BIS-BAS and the brain structure as assessed by gray matter volume. The multiple regression analysis showed that within a cluster consisting primarily of regions in the Frontal_Inf_Orb and the insula, there was a strong negative correlation between SDS/SAS scores and gray matter volume. For scores on the BIS–BAS, there was no discernible association. Figure 7 displays the details of the locations that had negative correlations with SDS/SAS scores.
Discussion
This study investigated the correlations between depression, anxiety, behavioral inhibition, fun seeking, and personality styles. By combining multivariate and mass univariate techniques, we were able to identify the neuroanatomical correlates of various personality types in people without access to psychiatric data. The results showed that those with high neuroticism had higher scores on both the SDS and SAS scales, which is in line with previous research. For example, Vreeke and Muris (2012) found neuroticism to be a risk factor for various mental health issues such as anxiety disorders and depression. However, we also found that those with high neuroticism had lower sensitivity to punishment, which contrasts with overwhelming evidence in the literature indicating the opposite (Dierickx et al., 2022; Mazloomzadeh et al., 2022; Smillie et al., 2007). This contradiction may be due to the relatively high neuroticism scores across all the participants in this study, even those in the N– groups. Meanwhile, individuals with high levels of neuroticism and extraversion had the lowest scores for fun seeking. High extraversion can be seen as a protective mechanism that makes individuals more likely to seek social support when faced with potentially stressful events, thus increasing their adaptive coping resources and reducing the likelihood of sensation seeking (Bonsaksen et al., 2019; Perry et al., 2018).
The results also showed a substantial correlation between the insula and anxiety and depression states, which may be connected to personality traits (Belcher et al., 2014; Deng et al., 2019). This finding supports previous studies that have indicated the role of the insula in emotional processing. Several scholars have argued that the cingulate gyrus, insula, and hippocampus, as the core brain regions involved in emotional processing, may be closely related to personality (Farkas et al., 2021; Lin et al., 2023; Yarkoni, 2015). In particular, the insula has been linked to the subjective experience of emotional states (Berntson & Khalsa, 2021; Molus & Kansal, 2022). Additional evidence from neuroimaging studies supports this theory by demonstrating insular activity when participants imitate the facial expressions of various emotions (happiness, sadness, anger, and fear) or physically experience a disgusting stimulation (Holtmann et al., 2020). Overall, patterns of neuroanatomical differences in the extraversion candidate brain system could identify personality styles; however, these patterns of neuroanatomical differences could not be used to identify particular personality traits (neuroticism or extraversion).
This study found personality styles were correlated with gray matter volume in regions important for impulse control (i.e., the frontal areas). In particular, the applications of SVM to the inferior frontal gyrus, midcingulate cortex, and neuroticism candidate brain system could classify varying extraversion levels among individuals with low levels of neuroticism; it could also distinguish varying neuroticism levels among individuals with low levels of extraversion. In addition to these, the applications of SVM to the inferior frontal gyrus, midcingulate cortex, and extraversion candidate brain system could distinguish between individuals with high scores or low scores for both neuroticism and extraversion. These findings suggest that traits related to impulse control and decision making may be present before personality styles form (Belcher et al., 2014; Yarkoni, 2015). Previous studies have revealed the role of the frontal cortex in general inhibitory control (Criaud et al., 2020; Friedman & Robbins, 2022; Menon & D’esposito, 2022) as well as sensitivity processing (Daniel et al., 2020; Hopfinger & Slotnick, 2020). Meanwhile, Salehinejad et al. (2021) showed that the medial orbitofrontal cortex was involved in the processing of the reward values linked to stimuli and behavior-related approaches. Lai et al. (2019) indicated that extraversion was significantly correlated with orbitofrontal cortex thickness and volume (see also Ide et al., 2020). Our findings support these studies by providing further evidence that neuroanatomical differences in the frontal cortex are related to individuals’ ability to control their attention, which may be the physiological mechanism for the formation of personality styles.
However, caution must be exercised when interpreting these findings. There are two potential causes of a single region’s high discriminative power in multivariate algorithms like SVM: (a) a variation in volume across groups in that region and (b) a variation in the correlation between groups in that region and other areas (Gong et al., 2013). Therefore, rather than being understood as distinct sections, the prefrontal and partially subcortical structural regions found in this study should be seen as a broadly distributed pattern.
This study has some limitations. For instance, mass univariate analysis is insensitive to geographically distributed effects; thus, it cannot be used to distinguish between distinct personality styles in individuals when utilizing functional or structural MRI data. Second, placing continuous features in discrete categories results in a loss of personality information. A closer approximation of how differential judgments are made in personality styles would have been obtained if the four participant groups had been separated according to the median of neuroticism and extraversion scores. In addition, the average neuroticism and extraversion scores in this sample were higher than those generally reported. Previous research has shown Chinese students to have mean neuroticism scores of around 120 and mean extraversion scores of around 130 (Yang, 2010), which are much higher than those of other young adult populations (Costa & McCrae, 2009). Since the participants in this study were all from the same region, the results should not be generalized to other regions or cultural groups. Future research could extend these findings by conducting similar studies in other countries and settings.
References
Table 1. Participants’ Demographic Details and Descriptive Statistics for Study Variables
Note. F = female; M = male; N = neuroticism; E = extraversion.
Table 2. Balanced Prediction Accuracy for Personality-Style Classifiers of Neuroticism System, Extraversion System, and Prefrontal Cortex Masks
Figure 3. Group Differences in Brain Structure in the Left Inferior Frontal Gyrus and Smaller Left Midcingulate Cortex
Table 3. Balanced Prediction Accuracy for Personality-Style Classifiers of Neuroticism System, Extraversion System, Inferior Frontal Gyrus, and Midcingulate Cortex Masks
Table 4. Balanced Prediction Accuracy for Personality-Style Classifiers of Glutamatergic System, Dopaminergic System, Inferior Frontal Gyrus, and Midcingulate Cortex Masks
This research was supported by the Chongqing Science and Technology Research Project (KJQN202204101), the Chongqing Education Scientific Planning Projects (2020-GX-045), the Higher Education Scientific Research Planning Projects of Chongqing Higher Vocational and Technical Education Research Association (GY201092), the Western Project of National Social Science Fund (22XSH012), and the Chongqing Youth Social Science Project (2021NDQN52).
Xinshuo Song, Chongqing Youth Vocational & Technical College, Xima Street, Beibei District, Chongqing, 400712, People’s Republic of China. Email: [email protected], or Yinghui Guo, School of Public Policy and Administration, Chongqing University, 174 Shazheng Street, Shapingba District, Chongqing, 400044, People’s Republic of China. Email: [email protected]