Performance during stress: Affective personality, age, and regularity of physical exercise
Main Article Content
Within stress research, self-report data are used generally to study the stress phenomenon (Watson, Pennebaker & Folger, 1987). Several studies have shown that self-reported data are strongly associated with different individuals’ affective state (e.g., Watson, Pennebaker & Folger). Some individuals are more prone than others to feel threatened by life’s difficulties. For example, anxious, neurotic people report more stress than do others (Watson, David & Suls, 1999), as do people who are relatively unhappy (Seidlitz & Diener, 1993). Thus, individuals' perceptions and appraisals of stress are highly subjective. Studies have indicated an underlying affective factor, Negative Affect (NA) correlated strongly with reported stress symptoms (Watson & Clark, 1984). Involvement of NA and Positive Affect (PA) has an influence upon how stress is expressed and reported (Melvin & Molly, 2000).
Negative tendencies have been shown to be maintained as relatively stable characteristics expressing feelings like anger, contempt, shame, fear and depression (Watson & Pennebaker, 1989). Costa and McCrae (1980) have found that NA, defined as the tendency to experience regularly several negative feelings over time in different situations (Spector & O´Connell, 1994), may last for 10 years or more. Thus, for example, high NA correlates with stresses and strains in a variety of situations and with events over which one experiences lack of control (Spector & O’Connell; Watson, Pennebaker, & Folger, 1987).
In contrast to NA, PA reflects enthusiasm, activity, control and commitment. PA incorporates an individual’s disposition to maintain a positive (happy) outlook over both time and in various situations (Watson, Pennebaker, & Folger, 1987). Individuals possessing a high degree of PA more often feel greater life satisfaction, are more secure, usually have better self-confidence (Varg, 1997), and have a higher level of activity (Costa & McCrae, 1980; Watson & Clark, 1984). They have more social relationships, experience greater satisfaction with their friends and have a greater social influence in different organizations (Watson & Clark). These authors (i.e., Watson & Clark) imply that PA also has a positive relationship with different biological and social rhythms, such as weather, circadian rhythm, week-days and season. Adjectives like passionate, enthusiastic, glad, active, energetic, alert and determined describe the character of positive affect (Watson & Clark, 1984; Watson, Clark, & Tellegen, 1988).
The Stroop Color and Word Test (SCWT, Stroop, 1935), a common instrument used to induce stress experimentally, has been shown to have stress-related and stress-generating properties (e.g., Bauer, & Besner, 1997). SCWT has been found to correlate with neuropsychological tests indicating stress (Aloia, Marx, & Weed, 1997) and Sothman, Hart, and Horn (1995) found that the Stroop Test induced a psychophysiological stress response and physiological changes were registered by significant increases in heart rate and plasma noradrenaline and adrenaline. Additionally, SCWT is applied clinically in the screening for frontal lobe damage (Wildgruber, Kischka, Fassbender, & Ettlin, 2000).
In the present study, the performance ability and health condition of bus drivers were compared with those of nurses and a group derived from a number of different occupations during stress measured with SCWT. Although similar studies are extant, one novel aspect here is the introduction of the concept, affective personality. Earlier studies have shown that both the positive and negative affective scales have explanatory value (e.g., Clark & Watson, 1988), but as pointed out by Watson and Pennebaker (1989) the PA and NA scales correlate markedly with different factors. Thus, according to these authors, studies that analyze how the two scales influence outcome at the individual level are required. Surprisingly, no studies have been conducted with that perspective. Consequently, the present study unites both scales of affect in a model of four personality types. An interesting hypothesis is whether or not the four-personality type model may elevate explanatory value associated with stress studies. Are there differences between the affective personality types with regard to performance during stress?
Method
Participants
The study consisted of 59 employed people, 43 men and 16 women, who had been in the same occupation over an average mean of 14.51 years (SD = 13.45). The participants were 22 bus drivers, 14 nurses and 23 from other occupations. The independent variable, personality type, consisted of four different types of personality (for further information, see section entitled “Design”). Chi-Square (Goodness-of-fit) analysis indicated that there were no significant differences with regard to occupation or gender in the four personality type groups (ps > 0.2). Mean age for the whole group of participants was 40.49 years (SD = 13.84). One-way ANOVA with personality type as the independent variable and age as the dependent variable did not indicate any significant differences (p = 0.343). In the present study, the age factor was analyzed as a second independent variable, age group, consisting of two categories (see section entitled “Design”).
The participants’ bill-of-health at the time of study demonstrated that 23 were smokers, 6 participants had blood pressure conditions and 7 had suffered from heart conditions. Further analysis showed that the study group as a whole consumed on average 3.85 cups of coffee per day (SD = 2.69), exercised on 8.07 occasions per month (SD = 6.38) for at least 30 minutes, and maintained an average body mass index (BMI) of 26.02 (SD = 4.04). A two-way ANOVA with personality type and age groups as independent variables and with number of cups of coffee, exercise habits and BMI as dependent variables and with Tukey-HSD (5% level) as a post hoc test, indicated that [F(3,51) = 5.50, p = 0.002] the self-actualization personality type exercised more (M = 13.38, SD = 8.35) than did either the self-destructive (M = 5.33, SD = 4.39) or low affective groups (M = 6.69, SD = 4.48), whereas the high affective group type was intermediate (M = 7.67, SD = 5.61). No other significant effects were evident in connection with the above analyses (ps > 0.05).
Design
The four personality types were derived through the combination of positive and negative affect, respectively. In this manner, 16 participants with low positive affect and low negative affect (the low affect group), 15 participants with both high positive affect and high negative affect (the high affective group), 15 participants with low positive affect and high negative affect the (self-destructive group) and finally 13 participants with high positive affect and low negative affect (the self-actualization group) were derived. The two age groups were derived through a division of the participants into two distinct age groups (cut-off point = 50.8%), comprising a young group (M = 29.07 years, SD = 5.39, n = 30), and an older group (M = 52.31 years, SD = 9.07, n = 29). There were no differences (Chi-square, goodness-of-fit) between the young and older groups in the four personality types (ps > 0.2).
Instruments
Blood pressure measurement. Blood pressure measurements were carried out using a BIOPAC polygraph, MP100WSW, Amplifier PPG 100B (applied to the participant's right arm) and with a digital blood pressure register AND UA-751 (applied to the left arm), calibrated against Omrion M4 and auditory with a stethoscope (i.e., the two pieces of apparatus were adjusted to give the same values). The blood pressure measurement of both arms was considered necessary in this procedure for reasons of control.
SCWT - Stroop Color and Word Test. The test was constructed originally by Stroop (1935) and incorporates both stress-related and stress-inducing characteristics (Bauer & Besner, 1997; MacLeod, 1991; Melara, & Mounts, 1993) with selective and divided attentional properties. It induces cardiovascular responses, such as changes in an individual's blood pressure and heart rate (Levine, Jarrett, Cain, & Heitkemper, 1997). The test also provides possibilities for measuring subjects' performance under stress conditions (Aine & Harter, 1984). The participants register their responses onto a test form that is corrected and quantified into the number of right answers. The test may be arranged to occupy either longer or shorter periods. The version applied in the present study occupied a 5-minute period. Words in different colors were displayed on a screen. The words yellow, green, blue and red were displayed in variable order and the words were presented in variable colors. For example, yellow was presented in varying blue, red, green or yellow simultaneously with a voice saying the word or the particular color displayed on the screen or another color contrasting with that on the screen. This procedure occurred 21 times. Following this, the whole procedure was repeated with different combinations of words and colors. Subjects were required to write down the colors that they had seen on the screen, not the words that were presented on the screen or spoken. Performance during stress was calculated for each participant by making a summation of the correct answers.
SE - Stress and Energy. The SE instrument was a self-estimation instrument concerning individuals’ energy and stress experiences (Kjellberg & Iwanowski, 1989). It is evaluated in two subscales that elucidate the mood levels of the subjects in the dimensions experienced stress and experienced energy. The response alternatives were ordered on six-grade scales, extending from: 0 = not at all, to 5 = very much. The instrument has been validated by analyses from studies focused upon occupational burdens and pressures (Iwanowski, 1989; Kjellberg & Bohlin, 1974; Kjellberg & Iwanowski, 1989).
PANAS - Positive affect and Negative affect Scales. The PANAS instrument (Kercher, 1992; Varg, 1997; Watson, Clark & Tellegen, 1988) estimates the degree of affectiveness, whether as negative or positive affectiveness. The instrument consists of 10 adjectives for the NA dimension and 10 adjectives for the PA dimension. In the test manual (Watson et al., 1988), it is postulated that the adjectives describe feelings (affect) and mood levels. Subjects were instructed to estimate how they had been feeling during the latest period. Response alternatives were presented on a five-grade scale, extending from: 1 = not at all, to 5 = very much. The negatively charged adjectives were summated to provide a NA result for negative affect and the positively charged adjectives were summated to provide a PA result for positive affect. The instrument has been validated by analyses from studies generally using these types of scales and focused upon matters relating to general aspects of psychopathology (Huebner & Dew, 1995). Wilson, Gullone, and Moss (1998) have shown that there is no significant correlation between the extent of positive and negative affectiveness which implies that there may be a divergent validity.
The results of the present study did not indicate any correlation of the two scales (negative/positive) with each other either (r = 0.12, p = 0.36). Following the correlational analysis the subjects’ responses were divided (cut-off point = 50.8%); with regard to positive affectiveness this division produced two parts, that is, one group that obtained low scores and one group that obtained high scores. The subjects’ responses were likewise divided (cut-off point = 50.8%), with regard to negative affectiveness, thereby producing two groups, one with low scores and one with high scores. According to this procedure the four different personality types were derived.
GPT - Glare Pressure Test. This test is constructed in a manner that simulates a situation in which a driver is exposed to a searchlight beam from an approaching vehicle shining directly into the individual’s eyes thereby effectively blinding the driver in conditions of darkness (Belkic, Ercegovac, Savic, Panic, Djordevic, & Savic, 1992; Belkic, Savic, Djordjevic, Uglejesic, & Mickovic, 1992). Subjects were asked to focus through a long narrow aperture in a 1-metre long cylinder that was connected to an ordinary car headlight with a 45-watt bulb. The inner surface of the cylinder was colored glossy black. The searchlight was connected to a power generator and to a regular pulse generator.
Procedure
Recruitment In order to recruit people of various ages and occupations to the present study, several notices were put up on bulletin boards in restrooms and cafeterias for bus drivers in the Karlstad (Sweden) area, in the restrooms at the local Karlstad hospital and in the various cafeterias for students/staff at Karlstad University. These notices were left in place for one month, by which time 22 bus drivers, 14 nurses and 23 people employed in other occupations had agreed to participate in the study. The group employed in other occupations included three university junior lecturers, two secretaries, two economists, two office workers, two military conscripts, two welders, two community-employed housing assistants, two health care administrators, two car mechanics, two cleaning staff, one curator, an accountant and an airplane technician.
Laboratory Procedure When each participant arrived at the Psychological Stress Laboratory at Karlstad University, he/she was asked to sit in a comfortable office chair. Each participant had earlier received the instruction to eat only sparingly (a light meal) during the day. Following this each participant was required to complete the questionnaire regarding background data and then PANAS was administered. After this, the instruction for SCWT was presented. Directly after the Stroop Test, systolic blood pressure was measured and following this each participant was asked to estimate his/her experience of stress and energy, using the SE-scale, during the Stroop Test. Following a pause of about 10 minutes, during which the subject was encouraged to relax, the GPT was carried out. Here, he/she was asked to look into a dark cylinder, through a column, while 5 pulses of light were administered directly into the eyes. The pulses were presented at 5-second intervals during a total test period of 55 seconds. After this, the participant once again completed the SE-scale and was then allowed to rest again for about 10 minutes, after which resting blood pressure was measured. None of the participants terminated his/her involvement in the experiment. After the experiment, each participant received information concerning its design and purpose at the same time as he/she was requested not to talk about the procedure and information to any of the others taking part.
Results
Correct Answers on the SCWT
Two-way ANOVA with personality type and age group as independent variables and with correct answers as the dependent variable indicated significant main effects for personality type [F(3,51) = 5.71, p = 0.002], age group [F(1,51) = 28.07, p < 0.001] and significant personality type x age group interaction effect [F(3,51) = 2.58, p = 0.048]. Further analysis (Tukey-HSD, 5% level) indicated that participants in the self-actualization group (M = 108.38, SD = 30.16) provided the most correct answers in comparison with the low affective group (M = 60.69, SD = 45.87), whereas the high affective (M = 97.67, SD = 30.37) and self-destructive (M = 79.73, SD = 47.49) groups were intermediary. Descriptive analysis indicated that the younger participants provided the most correct answers under stress (M = 107.73, SD = 15.38) compared with the older participants (M = 62.38, SD = 49.70). Interactional analysis (Bonferroni Independent Samples t-test) indicated that it was in the self-destructive and low affective groups that the significant differences between young and older groups lay, whereas neither the high affective nor the self-actualization groups provided significant differences with regard to age. Means and standard deviations pertaining to correct answers are presented in Table 1.
Experienced Stress and Energy
A Pillais’ MANOVA (4 × 2 factorial design) with personality type and age group as independent variables and with experienced stress after the Stroop Test, experienced stress after the Glare Test, experienced energy after the Stroop Test and experienced energy after the Glare Test as dependent variables did not indicate any significant effects (ps > 0.1). Mean values and standard deviations for experienced stress and experienced energy in each case are presented in Table 1.
Blood Pressure
Systolic blood pressure after the Stroop Test Two-way ANOVA with personality type and age group as independent variables and with systolic blood pressure (mmHg) after the Stroop Test as the dependent variable indicated no significant effects for interaction or personality type (ps > 0.08), but there was a significant difference in regard to age group [F(1,51) = 11.72, p = 0.001] where the younger participants had lower blood pressure (M = 131.93, SD = 14.54) as compared to the older participants (M = 151.55, SD = 25.36). Mean values and standard deviations for systolic blood pressure are presented in Table 1.
Systolic blood pressure after the Glare Test Two-way ANOVA with personality type and age group as independent variables and with systolic blood pressure (mmHg) after the Glare Test as the dependent variable did not indicate any significant effects for interaction or personality type (ps = 0.06), but there was a significant difference in regard to age group [F(1,51) = 14.17, p < 0.001] where the younger participants had lower blood pressure (M = 128.27, SD = 14.55) as compared to the older participants (M = 146.62, SD = 21.55). Mean values and standard deviations for systolic pressure are presented in Table 1.
Systolic blood pressure after resting Two-way ANOVA with personality type and age group as independent variables and with systolic blood pressure (mmHg) directly after resting as the dependent variable indicated a significant difference for personality type [F(3,51) = 5.55, p = 0.002] and for age group [F(1,51) = 17.96, p < 0.001] but not for interaction (p = 0.076). Further analysis (Tukey-HSD, 5% level) indicated that among the personality types the self-destructive group showed significantly higher blood pressure (M = 138.80, SD = 16.05) than did the high affective (M = 118.80, SD = 12.57), whereas the self-actualization (M = 125.31, SD = 13.31) and low affective (M = 133.44, SD = 19.91) groups were intermediary. Concerning the significant difference between age groups descriptive analyses showed that the younger participants had lower blood pressure (M = 121.13, SD = 11.36) as compared to the older participants (M = 137.72, SD = 18.49). Mean values and standard deviations for systolic pressure are presented in Table 1.
Table 1. Mean Values (M), Standard Deviations (SD), Minimum Values (Min) and Maximum Values (Max) for the Dependent Variables

Note: Correct answers, Stress after Stroop Test (stress-S), Stress after Glare Test (stress-G), Energy after Stroop Test (energi-S), Energy after Glare Test (energi-G), Systolic blood pressure after Stroop Test (systolic-S), Systolic blood pressure after Glare Test (systolic-G), Systolic blood pressure after resting (systolic-R).
Comparison Between Low and High PA
Since the analyses for some of the variables seemed to indicate a pattern whereby the personality types with low positive affect (i.e., self-destructive and low affective) performed differently from those with high positive affect (i.e., self-actualization and high affective) it was judged necessary to test this pattern statistically (Bonferroni Independent Samples t-test) by combining the participants with low PA into one group (n = 31) and those with high PA into another group (n = 28). Results indicated that the high PA group exercised more regularly (p = 0.027) and scored more correct answers in association with performance during stress (p = 0.009) in comparison with low PA individuals. Regarding systolic blood pressure after resting, it was found that the low PA groups recorded higher blood pressure (p = 0.003) compared with the high PA groups.
Correlational Analyses
Correlation coefficients (Pearson’s r) between the nine different dependent variables measured in the investigation were derived and tabulated. The results of the correlation analyses are presented in Table 2.
Table 2. Correlation Analyses (Pearsons’ R, Corrected for the Number of Comparisons According to Bonferroni) Between the Dependent Variables
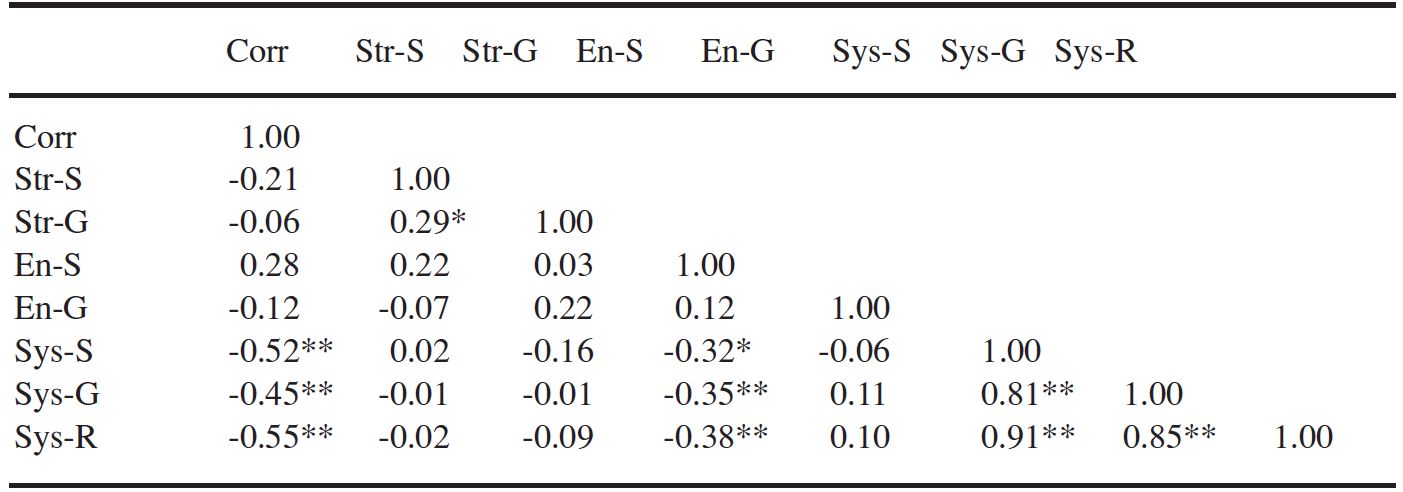
Note: Correct answers (Corr), Stress after Stroop Test (str-S), Stress after Glare Test (str-G), Energy after Stroop Test (en-S), Energy after Glare Test (en-G), Systolic blood pressure after Stroop Test (sys-S), Systolic blood pressure after Glare test (sys-G), Systolic blood pressure after resting (sys-R).
* = p < 0.05, ** = p < 0.01.
Discriminant Analysis
Step-wise discriminant analysis was performed by dividing the correct answers into three groups according to cumulative frequency (cut-off points: 30.5%, 66.1%), that is one group consisting of 18 participants with a few correct answers, another group of 21 participants with neither few nor many correct answers, and a third group of 20 participants with many correct answers were derived. These groups defined together the dependent variable “Correct answer category” while the independent variables were: age, exercise habits, experienced stress after Stroop Test and Glare Test, respectively, experienced energy after Stroop Test and Glare Test, respectively, systolic blood pressure after Stroop Test, Glare Test and resting, respectively, number of cups of coffee consumed, BMI, gender, occupational group, personality type, number of years in present occupation, level of stress prior to the start of the experiment, smoking/tobacco habits, as well as incidence of blood pressure and cardiovascular illness, respectively. All 59 participants were included in the analysis. The analysis generated four steps and excluded all the independent variables with the exception of age, stress after Stroop Test, energy after Stroop Test and exercise habits. These four variables could together correctly categorize 81.4% of the cases in any of the three groups in the “Correct answer categories” [Wilks’ Lambda (4, 2, 56) = 0.30, p = 0.016]. Follow-up analysis (descriptive) indicated that in the case of age the higher age level contributed strongly to the categorization in “Few correct” whereas the lower age level contributed strongly to “Intermediate correct” and “Many correct”, respectively. In the case of experienced energy after the Stroop Test, high stress levels contributed strongly to categorization in “Few correct” and “Intermediate correct” whereas low stress levels contributed strongly to “Many correct”. Experienced energy after the Stroop Test indicated an almost linear relationship that was dependent upon the function that the higher the level of energy the greater the number of correct answers. Finally, it was found that the stronger the exercise habits the stronger the contribution to categorization under “Many correct”.
Discussion
The present study indicated, in the context of the four affective personality types, that a high, positive level of affectiveness was a central prerequisite for potentially successful stress coping. The self-actualization individuals (i.e., those demonstrating high positive affect and low negative affect) were those who showed the best performance under the influence of stress at the same time as the high affective (i.e., high positive affect and high negative affect) showed the lowest levels of systolic blood pressure during resting. These findings should be contrasted against the evidence that the 'low affective' participants (i.e., low positive affect and low negative affect) showed the worst performance under the influence of stress and the self-destructive (i.e., low positive affect and high negative affect) showed the highest level of systolic blood pressure during resting. Also, note that the self-actualization and high affective groups in combination showed significantly better performance under the influence of stress and had lower blood pressure than did the self-destructive and low affective groups combined. Furthermore, it was found that for both personality types that encompassed high positive affect, no differences between younger and older participants were obtained with regard to performance under the influence of stress. In the cases of both personality types with low positive affect it was found that the younger participants performed better than did the older ones; possibly personality traits ought to be more carefully explored in analyses of stress effects upon different age groups. All these results may be inspected in Figure 1.

Figure 1. Positive affect scale (PA) and negative affect scale (NA) presented as two bisected, crossed-over axes with the results from dependent variables.
Consequently, the age factor was shown to exert a prominent involvement in the present study. The discriminant analysis derived the significance of the age factor already at the first step. The older participants also tended to express a feeling of greater stress on arrival at the laboratory, which was then followed by notably more incorrect answers during the Stroop test (i.e., performance under stress) compared with the younger participants. Why was it that the age factor exerted relatively less influence effect within the self-actualization and high affective personality types? One possible explanation is offered by the discriminant analysis wherein exercise habits emerged as an influential factor in relation to high performance during stress. It was evident that the self-actualization subjects had organized more regular exercise habits than had both the low affective and self-destructive, whereas the high affective subjects showed the next highest level of regularity in their exercise habits. The implication here is that regularity of exercise associated with positive affect contributed to the ability of older subjects in these groups to perform at a level comparable with that of the young subjects. Of necessity, the causal relationships between high positive affect and regularity of exercise habits in different age groups must be investigated in ongoing research.
It was found that the subjective experience of stress, as with the subjective experience of energy, during the completion of the Stroop Test influenced performance. Subjects expressing more stress experience performed worse than those expressing less stress; similarly, the higher the level of expressed energy experienced the better the level of performance. Systolic blood pressure measured directly after performance under stress influence offered a more objective measure indicating that the lower the blood pressure level, the more correct answers were obtained, and vice versa – the higher the blood pressure level was, the more incorrect answers were obtained.
It appears that age and affective personality influence strongly the degree to which workers perform during stress. It is well established that age is an important factor but the possibility of analyzing the integration of positive and negative affect at individual levels through procedures involving the four personality types is a novelty; this integration may be of particular significance in view of the differential effects of stress as a function of PA-NA in the higher age group. Thus, the evidence that degree of positive affect has greater influence upon performance during stress and upon systolic blood pressure during resting than does degree of negative affect ought to be of some consequence in both the diagnosis of, and coping strategies for, stress.
References
Aine, C. J., & Harter, M. R. (1984). Event-related potentials to Stroop stimuli. Color and word processing. Annals of the New York Academy of Sciences, 425, 152-153.
Aloia, M. S., Marx, B., & Weed, N. C. (1997) Some construct network effects of modifying the Stroop Color and Word Test. Clinical Neuropsychologist, 11, 54-58.
Bauer, B., & Besner, D. (1997). Processing in the Stroop task: Mental set as a determinant of performance. Canadian Journal of Experimental Psychology, 51, 61-68.
Belkic, K., Ercegovac, D., Savic, C., Panic, B., Djordevic, M., & Savic, S. (1992). EEG arousal and cardiovascular reactivity in professional drivers: The Glare Pressure Test. European Heart Journal, 13, 304-309.
Belkic, K., Savic, C., Djordjevic, M., Uglejesic, M., & Mickovic, L., (1992). Event related potentials in professional drivers: Heightened sensitivity to cognitively relevant visual signals. Physiology & Behavior, 52, 423-427.
Clark, L. A., & Watson, D., (1988). Mood and the mundane: Relations between daily life events and self-reported mood. Journal of Personality and Social Psychology, 54, 296-308.
Costa, P. T., Jr, & McCrae, R. R. (1980). Influence of extroversion and neuroticism on subjective well-being: Happy and unhappy people. Journal of Personality and Social Psychology, 38, 668-687.
Huebner, E. S., & Dew, T. (1995). Preliminary validation of the Positive and Negative Affect Schedule with adolescents. Journal of Psychoeducational Assessment, 13, 286-293.
Iwanowski, S. (1989). Utprovning av adjektivchecklistan. Enheten för psykofysiologi. [Testing the adjective checklist. Units or psychophysiology]. Solna, Sweden: Arbetsmiljöinstitutet.
Kercher, K. (1992) Assessing, subjective well-being in the old-old: the PANAS as a measure of orthogonal dimensions of positive and negative affect. Research on Aging, 14, 131-168.
Kjellberg, A., & Bohlin. (1974). Self-reported arousal: Further development of a multifactorial inventory. Scandinavian Journal of Psychology, 15 , 285-292.
Kjellberg, A., & Iwanowski, S. (1989). Stress/energiformuläret: Utveckling av en metod för skattning av sinnesstämning i arbetet. [The Stress/arousal questionnaire: Development of a method for assessment of mood at work] Solna, Sweden: Arbetsmiljöinstitutet, (Undersökningsrapport 1989:26).
Levine, B. S., Jarrett, M., Cain, K. C., & Heitkemper, M. M. (1997). Psychophysiological response to a laboratory challenge in women with and without diagnosed irritable bowel syndrome. Research in Nursing and Health, 20, 431-441.
MacLeod, C. M. (1991). Half a century of research on the Stroop effect: An integrative review. Psychological Bulletin, 109, 163-203.
Melara, R. D., & Mounts, J. R. W. (1993). Selective attention to Stroop dimensions: Effect of baseline discriminability, response mode, and practice. Memory & Cognition, 21, 627-645.
Melvin, G. A., & Molly G. N. (2000). Some psychometric properties of the Positive and Negative Affect Schedule among Australian youth. Psychological Reports, 86, 1209-1212.
Seidlitz, L., & Diener, E. (1993) Memory for positive versus negative life events: Theories for the differences between happy and unhappy persons. Journal of Personality and Social Psychology, 64, 654-664.
Sothmann, M. S., Hart, B. A., & Horn, T. S. (1995) Selected psycho-physiological stress responses in men with high and low body fatness. Medicine and Science in Sport and Exercise, 27, 417-422.
Spector, P. E., & O’Connell, B. J. (1994). The contribution of personality traits, negative affectivity, locus of control and Type A to the subsequent reports of job stressors and job strains. Journal of Occupational and Organisational Psychology, 67, 1-11.
Stroop, J. R. (1935). Studies of interference in serial verbal reactions. Journal of Experimental Psychology, 18, 643-622.
Varg, N. (1997) Negativ affektivitets inverkan på svarsbeteende i enkätformulär. [The influence of negative affect upon responses to questionnaires]. Stockholm: Stockholms Universitet.
Watson, D., & Clark, L. A. (1984). Negative affectivity: The disposition to experience aversive negative states. Psychological Bulletin, 96, 465-490.
Watson, D., Clark, L., & Tellegen, A. (1988). Development and validation of brief measures of positive and negative affect. The PANAS scale. Journal of Personality and Social Psychology, 54, 1063-1070.
Watson, D., David, J. P., & Suls, J. (1999). Personality, affectivity and coping. In C.R. Snyder (Ed.), Coping: The psychology of what works. New York: Oxford University Press.
Watson, D., & Pennebaker, J. W. (1989). Health complaints, stress, and distress: Exploring the central role of negative affectivity. Psychological Review, 96, 234-254.
Watson, D., Pennebaker, J. W., & Folger, R. (1987). Beyond negative affectivity: measuring stress and satisfaction in the workplace. Journal of Organizational Behavior Management, 8, 141-157.
Wildgruber, D., Kischka, U., Fassbender, K., & Ettlin, T.M. (2000) The Frontal Lobe Score: Part II: Evaluation of its clinical validity. Clinical Rehabilitation, 14, 272-278.
Wilson, K., Gullone, E., & Moss, S. (1998). The youth version of the positive and negative affect schedule: A psychometric validation. Behaviour Change, 15, 187-193.
Table 1. Mean Values (M), Standard Deviations (SD), Minimum Values (Min) and Maximum Values (Max) for the Dependent Variables
Note: Correct answers, Stress after Stroop Test (stress-S), Stress after Glare Test (stress-G), Energy after Stroop Test (energi-S), Energy after Glare Test (energi-G), Systolic blood pressure after Stroop Test (systolic-S), Systolic blood pressure after Glare Test (systolic-G), Systolic blood pressure after resting (systolic-R).
Table 2. Correlation Analyses (Pearsons’ R, Corrected for the Number of Comparisons According to Bonferroni) Between the Dependent Variables
Note: Correct answers (Corr), Stress after Stroop Test (str-S), Stress after Glare Test (str-G), Energy after Stroop Test (en-S), Energy after Glare Test (en-G), Systolic blood pressure after Stroop Test (sys-S), Systolic blood pressure after Glare test (sys-G), Systolic blood pressure after resting (sys-R).
* = p < 0.05, ** = p < 0.01.
Figure 1. Positive affect scale (PA) and negative affect scale (NA) presented as two bisected, crossed-over axes with the results from dependent variables.
Authors&rsquo
note
This study was supported by grants from the Swedish National Center for Research in Sports
Stockholm.
Appreciation is due to anonymous reviewers.